
Home » College SAT Score Ranges, Costs, and Programs by Major and State » Engineering Colleges by State: SAT Scores, ACT Scores, Costs, and ABET Programs
By Glyn Caddell, BSME · Author of Digital SAT Math Secrets · Tutoring since 2008 — Updated October 26, 2026

This page is the index of our state-by-state breakdowns of engineering colleges, and each state page lists every university in that state with an ABET-accredited engineering bachelor’s degree, the test scores of the students it admits and what it costs.
Every page uses the same source, the same columns and the same sort, so a student can read Alabama and Wyoming the same way, and every page carries one finding about that state’s engineering schools that a student would not get from a ranking.
Nothing in this collection ranks a school, and the tables are sorted by a published number, the midpoint of the admitted SAT Math or ACT composite range, so the order can be checked from the table itself.
Table of Contents
- Engineering Colleges in Every State
- What Is on Each State Page?
- Why Is the Engineering Range Not the University’s Range?
- What Should a Student Read Before the Score?
Engineering Colleges in Every State
Fifty state pages cover the ABET-accredited engineering universities in the United States, and each one is built the same way, from the same data, with its own finding.
Every page lists the universities in that state that hold an ABET-accredited bachelor’s degree in an engineering discipline, sorted by the midpoint of the admitted score range, with the cost of attendance, tuition for a resident and a non-resident, undergraduate enrollment and the admit rate for each. Pages for states where the ACT is the common test carry an ACT column and sort by it. Pages for states where no university reports a score, or where the public universities do not look at one, say so and sort by cost instead.
Alabama · Alaska · Arizona · Arkansas · California · Colorado · Connecticut · Delaware · Florida · Georgia · Hawaii · Idaho · Illinois · Indiana · Iowa · Kansas · Kentucky · Louisiana · Maine · Maryland · Massachusetts · Michigan · Minnesota · Mississippi · Missouri · Montana · Nebraska · Nevada · New Hampshire · New Jersey · New Mexico · New York · North Carolina · North Dakota · Ohio · Oklahoma · Oregon · Pennsylvania · Rhode Island · South Carolina · South Dakota · Tennessee · Texas · Utah · Vermont · Virginia · Washington · West Virginia · Wisconsin · Wyoming
A student from New York should start with New York, New Jersey, Pennsylvania and Connecticut, because those four states hold more accredited engineering programs within a three-hour drive of the city than most regions of the country hold in total, and because the price difference between them for a New Yorker is the subject of two of those four pages.
A student can see how many accredited engineering schools each state holds in the image above.
The list is where a student picks a state. The next section is what he will find when he gets there.
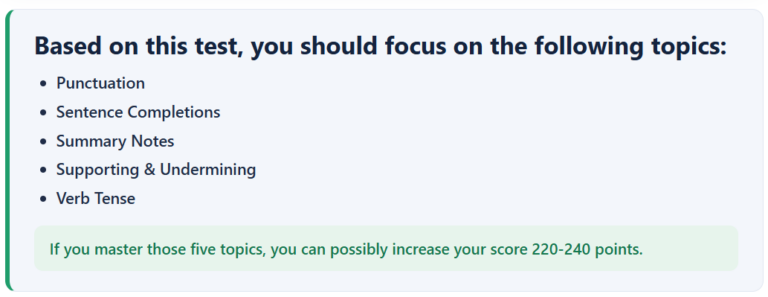
Want to Know What 5 Topics Will Improve Your SAT Score the Most?
Sample Feedback from our Diagnostic Test:
What Is on Each State Page?
Each state page carries the same table, the same entries, one finding specific to that state’s engineering schools, and the same closing sections, so a student who has read one can read all fifty.
The table lists every university in the state that holds an ABET-accredited bachelor’s degree in an engineering discipline, accredited by ABET’s Engineering Accreditation Commission. Engineering technology degrees, accredited under ABET’s separate Engineering Technology Accreditation Commission, do not put a university on the list, and each page names the universities that were left off for that reason. Regional campuses that award the main campus’s degree are counted under the main campus. Community colleges are not listed.
Each row carries the admitted SAT Reading & Writing and Math ranges, or the ACT composite range on ACT pages, the cost of attendance, the undergraduate enrollment and the admit rate, and each entry below the table carries tuition and fees for a resident and a non-resident. Every figure is from the College Scorecard’s 2025-26 release, and a university that reports no range to the Scorecard is listed last with that fact stated rather than filled in from somewhere else.
The finding is the section a ranking site does not have. On each page it is one thing about that state’s engineering schools, quoted from the university’s or the state’s own pages with the date, that changes what a student pays or what a score is worth there. Some are prices: the out-of-state premium of $360 a year at Youngstown State, the flat tuition at McNeese that undercuts the flagship’s resident rate, the state-related status that makes a Pennsylvania resident pay more for public engineering than a resident of any other state. Some are gates after admission: the GPA a student needs to get from General Engineering into a major at Clemson, from the college into mechanical engineering at Penn State, through the limited-enrollment review at Maryland. Some are scholarships decided by a test: the PSAT at Tulsa, the ACT Math score that places a student into calculus in Nevada. Some are structural: a flagship that awards no engineering degree at all in Oregon and Montana, a public university whose engineering degree comes with a second degree and a year abroad in Rhode Island.
Every page closes the same way: a section on which universities in the state hold accredited engineering schools and where they are, a section on what to do if the score is below the range, and short notes on reading the ranges, on which test the state’s colleges report, and on the neighboring states.
The table shows what a university admits. The next section is about why the engineering number is normally not that number.
Why Is the Engineering Range Not the University's Range?
The range a university publishes covers every student it admitted, and an engineering applicant is normally being measured against a narrower and higher slice of it, because engineering colleges fill with the students who scored highest on the Math section.
The Scorecard reports one range per university. A university that reports Math 580 to 680 admitted a quarter of its students below 580 and a quarter at or above 680, across every major it offers. Its engineering college took its students from the top of that distribution, and the range that would describe them, if the university published it, sits higher. The state pages print the university’s range because that is the number that exists, and they say so on every page where a university publishes a separate engineering figure beside it, as Minnesota does for its College of Science and Engineering and Colorado does for its engineering college.
The same thing cuts the other way at a university that admits by college. A student applying to engineering at a school that reports a wide range is competing against the top of it, and a student whose Math score sits in the lower half of the university’s range should read the engineering college’s own figure before he reads the university’s. Where a university sets a number at the engineering door, the state page quotes it: an ACT Math score, an SAT Math score, a calculus placement, a GPA in the first-year courses.
The image above shows where an engineering applicant’s score can sit inside the university’s range and outside the college’s.
That is the reason these pages exist as engineering pages and not as state pages. The last section is about what a student does with the number.
What Should a Student Read Before the Score?
A student should read three things on a state page before he reads where his score sits: whether the degree is accredited, what the university charges him as a non-resident, and whether there is a second gate after admission.
Accreditation first. Licensure as a professional engineer normally requires a degree from an ABET-accredited engineering program, and every university in every table holds one. A university that is not in a state’s table is not there because it awards no engineering degree, or because its engineering degree is an engineering technology degree, or because its program is new and not yet accredited. Each page names the schools in each group, and a student who finds his school in the third group is enrolling ahead of its accreditation.
Price second. Every entry gives tuition and fees for a resident and a non-resident, and the difference between the two columns is the subject of more findings in this collection than any other number. The premium runs from zero, at the universities that charge every student the same rate, to more than $40,000 a year for an engineering junior at Michigan. A New York student reading a public university’s range should read the non-resident column beside it.
The second gate third. At a growing number of universities, admission to engineering is admission to a first-year program, and the major comes after a set of courses at a stated grade and a stated GPA. The state pages quote those rules where the universities publish them, with the dates, because they change: Clemson’s civil engineering gate falls from 2.60 to 2.4 in fall 2026, and Penn State’s mechanical engineering gate is 3.20 at University Park and 2.60 at Scranton for the same degree. A student with a score inside the range and a transcript that will not clear the gate is reading the wrong number.
Then the score. The first step is finding out where it actually is, section by section. A free diagnostic SAT gives a score that can be set against the Math column on any state page, and a student who holds an ACT can convert it and read the same column.
The Math section rewards the same handful of topics on every test date, and a student who knows which of them he is missing can close a gap of 50 to 100 points in weeks rather than months. The method is on our page on improving your SAT Math score, and the topics it covers are the ones every engineering college’s first calculus course assumes.
How to Read the Score Ranges on These Pages
Every range in this collection covers the middle 50% of admitted students who submitted that test. The lower number is the 25th percentile and the upper number is the 75th, so a quarter of admitted students scored at or above it. At the handful of universities whose upper Math number is 800, the top quarter scored exactly 800.
Because most colleges are now test-optional, the ranges that are published describe only the students who chose to submit at all. Students with strong scores submit and students with weak ones don’t, so a published range sits higher than the range for everyone who was actually admitted. More on what SAT score you need for college and on test-optional colleges.
Which Test Do the Pages Use?
Each state page uses the test that more of that state’s universities report. Where more report the SAT, the table carries the two SAT sections and sorts by Math. Where more report the ACT, or where the state gives the ACT to its juniors and the count is close, the table adds an ACT composite column and sorts by it, and the page says which rule applied. A university that reports neither test is listed last on every page.
Every university on every page accepts either test, and a student who holds the other one should convert it and read the same columns.
Other Majors by State
We publish the same state-by-state breakdown for other fields, each with its own finding per state.
See pre-med colleges by state and the full colleges index.

Glyn Caddell
Glyn Caddell holds a BS in Mechanical Engineering from NJIT and has been tutoring New York City students since 2008. He founded Caddell Prep in 2012 and is the author of Digital SAT Math Secrets: Lessons & Tricks to Quickly Improve to a Perfect 800 on the Math Test, which contains over 900 practice problems and is used in Caddell Prep’s SAT math classes. He is founding president of the Staten Island Technical High School alumni association and teaches every lesson on this site personally.
Finally, an SAT course that students actually understand
Every question has a video explanation. Not most — every one.
The on-demand Digital SAT course covers all 17 math topics and 15 reading and writing topics, with 5 full-length practice tests and a 100-point score increase guarantee. Keep access for the rest of high school. No subscription.
Want to Know What 5 Topics Will Improve Your SAT Score the Most?
Sample Feedback from our Diagnostic Test: