In this video, we will learn how to interpret and create a box & whisker plot, learn how to quickly look at a box and whisker plot and determine the lowest value, first quartile, median, third quartile and greatest value. After you finish this lesson, view all of our Pre-Algebra lessons and practice problems.
Example of a Box and Whisker Plot

Highest and Lowest Values
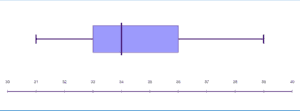
In this Box & Whisker Plot, the lowest value in a set is identified by the line at 12. The greatest value in a set is identified by the line at 25. The lines connecting the lowest and greatest values to the box are called the “Whiskers”.
Quartiles
The box is made up of three “Quartiles”. The second quartile is the median of the set between the lowest value and the greatest value. The second quartile in this plot is identified by the line at 13. The first quartile is the median of the set between the lowest value and the second quartile. The second quartile in this plot is identified by the line at 18. The third quartile is the median of the set between the second quartile and the greatest value. The second quartile in this plot is identified by the line at 22.
In a Box & Whisker Plot, we know 25% of the numbers in the set is located between the lowest value and the first quartile. We also know 25% of the numbers in the set is located between the first quartile and the second quartile, 25% of the numbers in the set is located between the second quartile and the third quartile, and 25% of the numbers in the set is located between the third quartile and the greatest value.

Example of Box And Whisker Plot
Example 1
In box and whiskers plot, we have a box and two lines sticking off known as whiskers.
The whiskers extend into the lowest value and the greatest value.
The start represents the lowest value, which is  .
.
Where it ends is the greatest value which is  .
.
The box is made up of quartiles.
The beginning of the box is called the first quartile which is  .
.
The middle of the box which is  , is the second quartile (
 ) or also known as the median of all the numbers.
And the end of the box is the third quartile ( ) which is
  .
.
Example 2
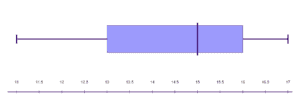
In box and whiskers plot, we have a box and two lines sticking off known as whiskers.
The whiskers extend into the lowest value and the greatest value.
The start represents the lowest value, which is  .
.
Where it ends is the greatest value which is  .
.
The box is made up of quartiles.
The beginning of the box is called the first quartile which is  .
.
The middle of the box which is  , is the second quartile () or also known as the median of all the numbers.
And the end of the box is the third quartile () which is  .
.
Video-Lesson Transcript
Today we’re going to discuss ‘box and whisker plot’.
Box and whisker plot is somewhat tied with quartiles.
This is a quick way of representing the different quartiles of a set of numbers and also lowest and greatest value.
There are important pieces of information based on this drawing.
In the example, the start is the lowest number on the drawing. This also represents the lowest value. In the example, we have  .
.
Where it ends is the greatest value. In the example, we have  .
.
In our box and whiskers plot, we have a box and two lines sticking off known as whiskers.
The whiskers extend into the lowest value and the greatest value.
The box is made up of quartiles. The beginning of the box is called the first quartile ( ). In this example, it’s .
The middle of the box or in our example is  , is the second quartile () or also known as the median of all the numbers.
And the end of the box is the third quartile (). In the example, it’s  .
.
Now, let’s break it down to percent.
Whatever set of numbers were, we know that  is between the lowest value and the first quartile. In our example, it’s and .
We also know that the second is between the first quartile and the second quartile. In our example, it’s from to .
The next is between the second quartile and the third quartile. In the drawing, we have and .
And the last fall between the third quartile and the greatest value. In the example, we have and .
So the number is greater than  of all the numbers.
And the of numbers is greater than which represents the third quartile.
Just to recap, the box and whiskers plot contains a box and two whiskers sticking off the edges of the box.
The whiskers extend to the lowest value and to the greatest value.
The box is made up of the first quartile, second quartile, and third quartile.