An understand of functions is necessary to do well on the SAT. Some questions will ask to evaluate functions. More complex questions will ask you to determine the independent value (normally the  -value) that results in the dependent value (normally the
  -value)
Let’s start by looking at the equation of a line,  .
.
We can find points on the line by substituting in values for and evaluating it to find the associated values of .
For example, if we have the equation  we can substitute in some values for and find the associated -values.
When  , we would have
 +1=7") . The value of the function would be 7 when is 3.
. The value of the function would be 7 when is 3.
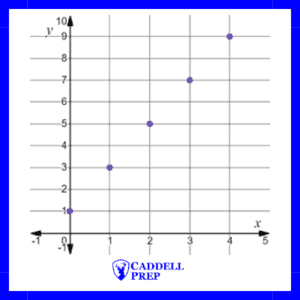
We can find many different values for by substituting different values for . Here is a table showing different -values and different -values (function values).
| x | 2x+1 | y |
|---|---|---|
| 0 | 2(0)+1 | 1 |
| 1 | 2(1)+1 | 3 |
| 2 | 2(2)+1 | 5 |
| 3 | 2(3)+1 | 7 |
| 4 | 2(4)+1 | 9 |
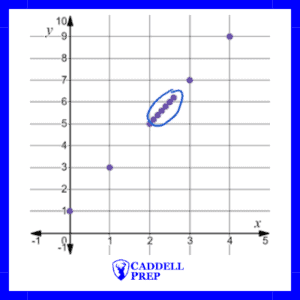
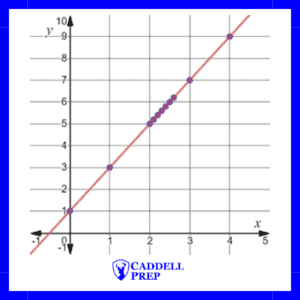
We can plot those points on a graph
We looked at the simple function  . It can be written as
 =2x-1") ,
, =2x-1") ,
, =2x-1") ,
, =2x-1") ,
, =2x-1") , etc.
, etc.
Don’t be confused when you see the notation ") , it is similar to . is the notation used to refer to the function when it is in terms of .
, it is similar to . is the notation used to refer to the function when it is in terms of .
However, if we want to show the value of a function at a specific -value, we would substitute the value in for .
For example=-2x-5") ,
,=-2(3)-5") ,
,=-11")
Let’s look at a table
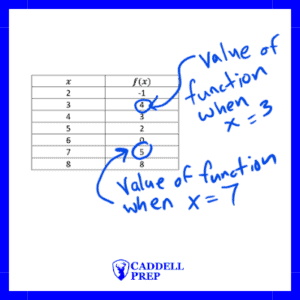
If we want to find out what ") or what the value of the function is when , we would look at the value of when the -value is
or what the value of the function is when , we would look at the value of when the -value is  . In this case
 =4") .
.
If we want to find out what ") or what the value of the function is when
or what the value of the function is when  , we would look at the value of when the -value is
  . In this case
 =5") .
.
A graph of a function, , will likely have the vertical axis labeled instead of . The horizontal axis will be labeled .
A graph of ") will likely have the vertical axis labeled instead of and the horizontal axis labeled
will likely have the vertical axis labeled instead of and the horizontal axis labeled  instead of .
Here is an example.
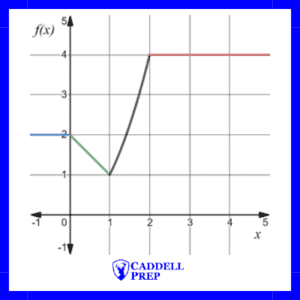
We can see that the value of the graph changes at different spots on the graph.
The value of is  when is
  .
.
=4") ,
,
=4") ,
,
,
and =4") .
.
In fact, the value of the function is  when is equal to or greater than and less than or equal to
  .
.
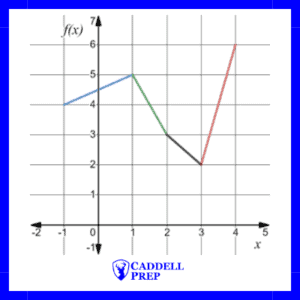
Based on the graph above, what is
a) ") ?
?
b) The value of the function when is ?
c) The value of when is ?
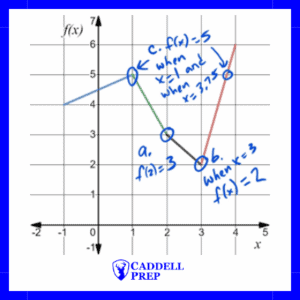
a) is the -value when  . In the graph, when is 2, is 3.
b) The value of a function is the -value, so the value of the function when is 3 is the -value when is 3. In the graph, when ,  .
.
c) To find the value of when is 5, we have to find the point (or points) on the graph where the -value is 5. They -value is 5 when is 1 and when is 3.75, so the answer could be 1 or 3.75.
The equation of a line is typically written in slope-intercept form, .
It is called slope-intercept form because you can easily identify the slope and -intercept.
where  is the slope and
  is the -intercept.
Example
In the equation  , the slope is 2 and the -intercept is 3.
A slope of 2 really means the slope is  . As you move from left to right, the line goes up 2 and right 1.
A -intercept of 3 means the slope intersects the -axis at 3. This is a good starting point when graphing.
Example
In the equation  , the slope is
  and the
  means as you move from left to right, the line goes down 3 and right 2.
A -intercept of 1 means the slope intersects the -axis at 1. This is a good starting point when graphing.
Lines that are parallel have the same slope.
For example, if the equation of one line is  , a line parallel to it could have the equation
 . As long as the lines have the same slope and different -intercepts, they’re parallel.
Lines that are perpendicular, have slopes that are the negative reciprocal of each other.
For example, if the slope of one line is  then the slope of a line perpendicular to it will be
  .
.
Linear functions can be written in a form similar to the equation of a line, .
Linear functions are functions that increase or decrease at a constant rate, such as the amount of money paid for a gym membership. The membership may require an initial payment to join, followed by a monthly payment. The total amount of money paid increases at a constant rate since each month the total increases by the set monthly payment.
For example, it may cost $30 to join a gym plus $15 each month. After one month of membership you may have paid $45 ($30 to join and $15 monthly payment). The next month you’ll pay another $15, so the total paid will then be $60. The following month will be another $15, so the total paid will then be $75. Each month the total increases by $15. Let’s graph it.
Since we have a starting value of $30 and a rate of increase of 15, we can use the  to represent the function. Below is a graph including the function and points.
The key point is that if something increases at a constant rate, it can be modeled using the equation of a line as a linear function. The rate of change will be the slope and then initial value is typically the y-intercept.
Note about the variables.
Keep in mind that the variables used in a linear function do not have to be and . The variables can be any letter.
In the previous example, the total cost may be represented by  and each month by . The function would be written as
  . In this case m is the variable for number of months and 30 is the slope.
The function is sometimes also written as ") instead of just . is simply just a way of stating that the cost is dependent on the months, . In other words, is a function of .
instead of just . is simply just a way of stating that the cost is dependent on the months, . In other words, is a function of .
Example
A company’s monthly expense is $20,000 each month for rent and other fixed costs. The products that the company creates cost $120 to produce. Write a function that represents the total cost in terms of the number of products produced,  .
.
In this case, the cost increases at a constant rate. It increases by $120 for each product produced, so the slope is $120. Even if no products are produced, there is a cost of $20,000, so that is the starting value or -intercept.
Quadratic functions have the basic format of
=ax^2+bx+c")
where  ,
,  and
and  are constants.
It isn’t necessary to have a  term or a term, but it must have an
  term.
term.
Example of quadratics are
=x^2+3x-5") ,
,
=2x^2") ,
,
=-3x^2-5") ,
,
and =x^2-5") .
.
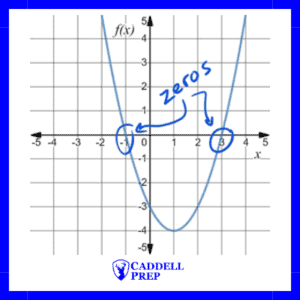
You can always find the zeros of a quadratic function by using the quadratic formula.

If you can’t figure out the factors or if it isn’t factorable, use the quadratic formula.
Make sure to use parenthesis when you substitute the values in.
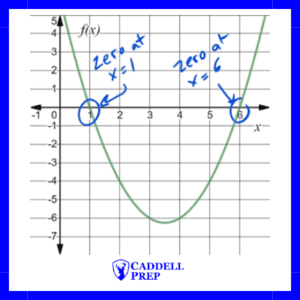
Let’s look at the same function, we looked at earlier =x^2-7x+6") .
.
Example
What are the zeros of the function ?
 ,
,  ,
,  ,
,
,
+-\sqrt{(-7)^2-4(1)(6)}}{2(1)}") ,
,
 ,
,
 ,
,
 ,
,
From this, we get two possible solutions
 and
and 
which results in
 and
and 
simplified to
 and
and 
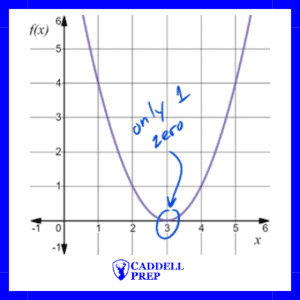 The function only intersects the -axis once, so there is only one zero (root). |
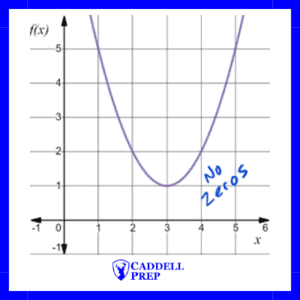 The function doesn’t intersect the -axis, so there are no zeros (roots). The function doesn’t intersect the -axis, so there are no zeros (roots). |
Example of One Zero
The function =x^2-6x+9") only has one zero. We can see by factoring or using the quadratic formula.
only has one zero. We can see by factoring or using the quadratic formula.
From factoring:
 ,
,
(x-3)=0") ,
,

From the quadratic formula:
,
 ,
,
+-\sqrt{(-6)^2-4(1)(9)}}{2a}") ,
,
 ,
,

so, our solutions become
 and
and 
but we end up with the same solution
Example of No Zeros
The function =x^2-6x+10") doesn’t have a zero.
doesn’t have a zero.
We can’t factor it, so let’s look at it by using the quadratic formula.
,
+-\sqrt{(-6)^2-4(1)(10)}}{2(1)}") ,
,
+-\sqrt{36-40}}{2}") ,
,
+-\sqrt{-4}}{2}") ,
,
We end up with the square root of a negative number, which is not real, so there are no real roots.
Sometimes on the SAT, a question will ask for the number of roots or a similar question.
The following questions are all asking the same thing:
- To find the number of real solutions to

- To find the number of zeros the function has
- To find number of roots of the function has

=x^2+3x+4") has
hasIn each of the above questions, we would find the zeros using a graph, factoring, or the quadratic formula.
To find the sum or product of the roots of a quadratic function, you could solve for the roots and then add them together to find the sum or multiply them to find the product.
The problem is that if the roots are irrational, such as  and
and  , it could be a little difficult to find the sum or product.
Instead, we can use two formulas to find the sum or product of the roots immediately.
If the function is in the form , we can use the following formulas:
sum of roots=
product of roots=
Example
Find the sum and product of the roots of the function =2x^2+3x-8") .
.
Explanation & Solution
sum of roots=
product of roots=
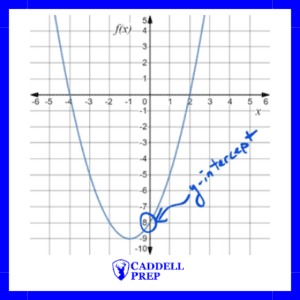
Here are three ways of writing the same function:=x^2+2x-8")
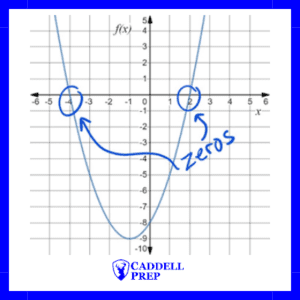
=(x+4)(x-2)")
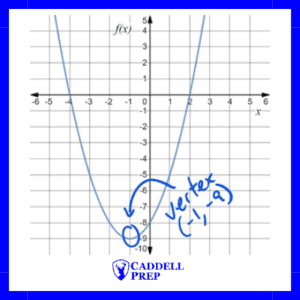
=(x+1)^2-9")
The top form is just a standard form. From , we can identify the -intercept,  .
.
 lets us readily identify the zeros (roots) of the function, which are
  and . Since it is a factored form of the function, we would set each factor to zero and solve for in each.
.
and . Since it is a factored form of the function, we would set each factor to zero and solve for in each.
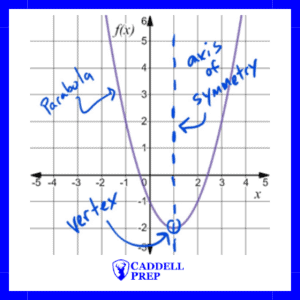
.  , lets us readily identify the vertex and axis of symmetry. This function shows the function
  being translated left 1 unit and down 9 units, which would put the vertex at
 ") . The axis of symmetry also passes through the vertex, so the axis of symmetry is
. The axis of symmetry also passes through the vertex, so the axis of symmetry is  .
. 
Example
Which of the following formats of the function =x^2+2x-3") can be used to quickly identify the vertex?
can be used to quickly identify the vertex?
A. ^2+4")
B. (x-1)")
C. (x+1)")
D. ^2 -4")
Explanation & Solution
We can eliminate choices B and C because the answers are not written in vertex form. They are written in a way that we can identify the zeros, but not the vertex.
We should multiply A and D out to see if we get the same functions as the one given.
,(x-1)+4") ,
, ,
,
Choice A doesn’t work out, so we should try choice D.^2-4") ,
,(x+1)-4") ,
, ,
,
Choice D is the answer.
If the function is written in standard form,  , we can quickly identify the axis of symmetry of a quadratic function with the following formula:
You might recognize this. It’s the first part of the quadratic formula,
The axis of symmetry passes through the vertex, so the -coordinate of the vertex is the same as the axis of symmetry.
Example
Write the vertex form of the function  .
.
Explanation & Solution,}") ,
,
This means the -coordinate of the axis of symmetry is -3. We can substitute -3 in for in the function to find the -coordinate of the vertex.,^2+6(-3)-5") ,
, ,
,
The vertex form of the equation is ^2-14") .
.
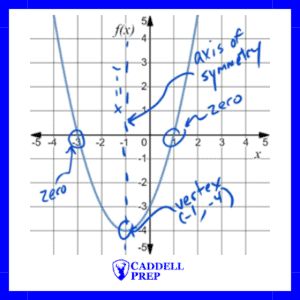
If the function is written in a form that allows us to immediately find the zeros, then the second trick we can use is that the vertex and axis of symmetry exist exactly in the middle of the two zeros. You can find the axis of symmetry (-coordinate of the vertex) by taking the average of the two numbers.
For example, if a function is , then the zeros of a function are -3 and 1. We can find the axis of symmetry and the -coordinate of the vertex by taking the average of the two numbers.
Average of the zeros= .
.
The vertex is located at and the axis of symmetry is .
Since we know the -coordinate of the axis of symmetry, we can substitute it into the functions to find the y-coordinate.,=(-1)^2+2(-1)-3") ,
,=1-2-3") ,
,=-4") ,
,
The vertex is ") .
.
Below is a diagram to illustrate the concept.
 and coefficient in front of is
  , then vertex form of the function is
 =(x+1)^2-4") .
. =-16t^2+128t+768") , for
, for  . From what height was the projectile fired?
 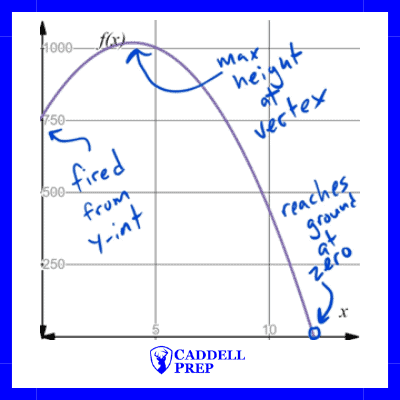 -intercept.