
Home » College SAT Score Ranges, Costs, and Programs by Major and State » Best Pre-Med Colleges » Pre-Med Colleges in Washington: SAT Scores, Costs, and Programs
By Glyn Caddell, BSME · Author of Digital SAT Math Secrets · Tutoring since 2008 — Updated October 17, 2026
Sixteen Washington colleges with pre-med programs, what they cost, and the SAT scores of the students they admit.
Washington’s public universities removed the SAT and ACT requirement permanently, so the two largest universities in the state publish no admitted score ranges at all, and the state’s medical school holds approximately 95% of its 280 seats for residents of five states.
Scores are given by section rather than as a single total, because a student at 650 Reading & Writing and 540 Math is in a different position from a student at 540 and 650.
Two abbreviations matter later on this page. MD is the degree awarded by most medical schools in the United States. DO is the degree awarded by colleges of osteopathic medicine, and DO holders are licensed physicians with the same practice rights. Washington has two of the first and one of the second.
Table of Contents
- Washington Pre-Med Colleges by SAT Score
- Why Do Washington’s Public Universities Publish No SAT Scores?
- What Does the Washington College Grant Require?
- How Many UW Medical School Seats Go to Each State?
- What Medical Schools Are in Washington?
- Saint Martin’s Reports Two Score Ranges That Disagree
- What If Your Scores Are Below the Range You Want?
Washington Pre-Med Colleges by SAT Score
The table below covers four-year public and non-profit institutions in Washington awarding bachelor’s degrees or higher, with at least 1,000 undergraduates, that report an admit rate or admitted test scores. Sixteen institutions meet that description.
Seven of those sixteen rows carry no score ranges, and for six of them the reason is not a gap in the reporting. Six of Washington’s eight public universities in this table publish no admitted scores at all, including the two largest institutions in the state, because those universities no longer ask applicants for a score. The section after the table covers the policy behind it. Seven of the eight private colleges here do publish ranges.
Colleges are sorted by the midpoint of the two section ranges, with ties broken on the Math 75th percentile. The seven colleges reporting no scores go last, ordered by size. There is no ACT column because the same nine institutions report both tests, so the ACT set is neither larger than the SAT set nor different from it, and a column would add nothing the table does not already carry. Where an ACT range is worth knowing for a particular college, it appears in that college’s entry.
| College | Reading & Writing | Math | Cost of attendance | Undergraduates | Admit rate |
|---|---|---|---|---|---|
| Whitman College | 670 to 740 | 640 to 740 | $78,092 | 1,531 | 38% |
| Seattle University | 620 to 710 | 580 to 720 | $72,124 | 4,062 | 77% |
| Gonzaga University | 600 to 700 | 590 to 680 | $73,178 | 5,198 | 82% |
| University of Puget Sound | 610 to 710 | 560 to 670 | $78,378 | 1,594 | 72% |
| Western Washington University | 590 to 710 | 560 to 680 | $30,359 | 13,544 | 93% |
| Whitworth University | 550 to 670 | 540 to 660 | $68,516 | 1,858 | 90% |
| Pacific Lutheran University | 540 to 660 | 500 to 600 | $62,459 | 2,401 | 78% |
| The Evergreen State College | 540 to 663 | 495 to 590 | $28,477 | 2,160 | 96% |
| Saint Martin’s University | 510 to 610 | 515 to 620 | $62,449 | 1,158 | 90% |
| University of Washington-Seattle Campus | Does not report SAT data | Does not report SAT data | $32,446 | 31,942 | 39% |
| Washington State University | Does not report SAT data | Does not report SAT data | $27,648 | 21,099 | 87% |
| Central Washington University | Does not report SAT data | Does not report SAT data | $28,816 | 7,833 | 91% |
| Eastern Washington University | Does not report SAT data | Does not report SAT data | $24,478 | 6,222 | 91% |
| University of Washington-Bothell Campus | Does not report SAT data | Does not report SAT data | $26,908 | 5,457 | 91% |
| University of Washington-Tacoma Campus | Does not report SAT data | Does not report SAT data | $25,346 | 4,185 | 83% |
| Seattle Pacific University | Does not report SAT data | Does not report SAT data | $56,826 | 1,762 | 83% |
Each range covers the middle 50% of admitted students who submitted scores. A quarter scored below the lower number, and the top quarter scored at or above the upper one. Being under the lower number does not rule a student out, and being just above it is not as safe as it looks. For the seven colleges with no published range, there is no figure of any kind to compare a score against.
Five things in the table are worth saying out loud before the entries.
The most selective institution in Washington is Whitman College at 38%, marginally ahead of the University of Washington at 39%. A liberal arts college of 1,531 students in Walla Walla admits a smaller share of its applicants than a flagship of 31,942.
The most expensive is the University of Puget Sound at $78,378, and it sits $286 ahead of Whitman at $78,092. Gonzaga follows at $73,178 and Seattle University at $72,124.
Six of the eight public universities publish no admitted scores, and those six enroll 83% of the public university undergraduates in this table.
All three University of Washington campuses charge non-residents exactly $30,236 more than residents. Seattle charges $12,973 and $43,209, Bothell $12,919 and $43,155, and Tacoma $13,168 and $43,404. Three identical gaps across three campuses is a system-level figure rather than three coincidences, though the UW Board of Regents is where the mechanism is actually set out.
Washington State charges the highest in-state tuition of any public university here at $13,391 and has the smallest non-resident gap at $16,559. Eastern Washington charges the lowest in-state tuition at $8,586. The gaps across the eight publics run from $16,559 to $30,236.
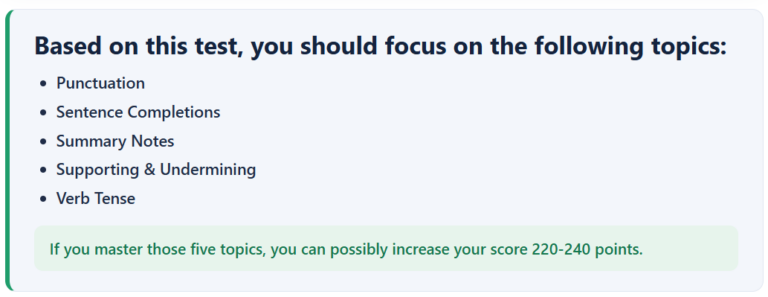
Want to Know What 5 Topics Will Improve Your SAT Score the Most?
Sample Feedback from our Diagnostic Test:
Whitman College
Whitman College is a liberal arts college in Walla Walla with 1,531 undergraduates. It is the most selective institution on this page, admitting 38% of applicants, and it is one of the seven private colleges here that still publishes admitted score ranges.
Admitted students scored 670 to 740 in Reading & Writing and 640 to 740 in Math. The top quarter sat at or above 740 in both sections. Whitman also reports an ACT composite of 29 to 33. Cost of attendance is $78,092 with tuition and fees of $64,050.
Whitman is the clearest case on this page of a college where a score still carries weight. Nothing else in Washington combines a sub-40% admit rate with published ranges in the 700s.
Seattle University
Seattle University is a Jesuit university on Capitol Hill in Seattle with 4,062 undergraduates. It admits 77% of applicants and charges $72,124 in cost of attendance, with tuition and fees of $56,721.
Admitted students scored 620 to 710 in Reading & Writing and 580 to 720 in Math, with the top quarter at or above 710 and 720. The reported ACT composite is 23 to 30. That seven-point spread is one of the wider ones in Washington.
The gap between Seattle University’s selectivity and its scores is worth noticing. It admits more than three applicants in four while reporting the second-highest Reading & Writing range on this page, which normally indicates a self-selecting applicant pool rather than a hard cutoff.
Gonzaga University
Gonzaga University is a Jesuit university in Spokane with 5,198 undergraduates, and it hosts one of the five Foundations sites for the University of Washington School of Medicine. Students in the WWAMI program covered later on this page complete their first phase of medical school on Gonzaga’s campus.
Gonzaga admits 82% of applicants. Cost of attendance is $73,178, the third highest in the state, with tuition and fees of $55,480. Admitted students scored 600 to 700 in Reading & Writing and 590 to 680 in Math, and the reported ACT composite is 27 to 31.
A private Catholic university hosting the regional site of a public medical school is an unusual arrangement, and it puts medical school faculty and facilities on a campus in this table.
University of Puget Sound
The University of Puget Sound is a liberal arts college in Tacoma with 1,594 undergraduates. Its cost of attendance of $78,378 is the highest of any institution on this page, $286 ahead of Whitman, with tuition and fees of $62,898.
Puget Sound admits 72% of applicants. Reported ranges are 610 to 710 in Reading & Writing and 560 to 670 in Math, with the top quarter at or above 710 and 670. It also reports an ACT composite of 27 to 31.
The ACT figure sits noticeably higher than the SAT figure in concordance terms, and the last section on this page works through that pattern.
Western Washington University
Western Washington University is a public university in Bellingham with 13,544 undergraduates, and it is one of only two public universities in this table that publishes admitted score ranges. It admits 93% of applicants.
Admitted students scored 590 to 710 in Reading & Writing and 560 to 680 in Math. The reported ACT composite is 24 to 31. Cost of attendance is $30,359, with in-state tuition and fees of $9,582 against $28,707 for non-residents.
Western is the useful reference point for the six publics below it that publish nothing. It is the second-largest public university on this page by enrollment, admits almost everyone who applies, and its published ranges still reach into the 700s at the upper end.
Whitworth University
Whitworth University is a private Christian liberal arts university in Spokane with 1,858 undergraduates. It admits 90% of applicants and charges $68,516 in cost of attendance, with tuition and fees of $52,880.
Reported ranges are 550 to 670 in Reading & Writing and 540 to 660 in Math. The ACT composite runs 21 to 29, an eight-point spread and the widest reported in Washington.
Whitworth and Gonzaga sit in the same city with very different cost and score profiles, which makes Spokane one of the few places in the state where a student has two private options worth comparing directly.
Pacific Lutheran University
Pacific Lutheran University is a private university in Parkland, just south of Tacoma, with 2,401 undergraduates. It admits 78% of applicants, the second-lowest rate among the private colleges here after Whitman and Puget Sound.
Cost of attendance is $62,459 with tuition and fees of $52,254. Admitted students scored 540 to 660 in Reading & Writing and 500 to 600 in Math, with the top quarter at or above 660 and 600. The reported ACT composite is 22 to 28.
The Evergreen State College
The Evergreen State College is a public liberal arts college in Olympia with 2,160 undergraduates, and it assesses student work through narrative evaluations written by faculty rather than through letter grades. Its own registration office says graduate schools appreciate the level of detail that format carries.
Evergreen admits 96% of applicants, the highest rate on this page. Cost of attendance is $28,477, with in-state tuition and fees of $9,264 against $31,905 for non-residents. Reported ranges are 540 to 663 in Reading & Writing and 495 to 590 in Math, with an ACT composite of 23 to 29.
A pre-med student should raise the transcript question with Evergreen’s registration office early rather than late. Medical school application services calculate a grade point average from a transcript, and a student planning to apply through one should know in advance how Evergreen’s evaluations are presented to it.
Saint Martin's University
Saint Martin’s University is a Benedictine Catholic university in Lacey with 1,158 undergraduates, the smallest institution on this page. It admits 90% of applicants and charges $62,449 in cost of attendance, with tuition and fees of $45,510.
Reported ranges are 510 to 610 in Reading & Writing and 515 to 620 in Math, and Saint Martin’s is the only college here where Math sits above Reading & Writing at both ends. It also reports an ACT composite of 16 to 20.
Those two score sets do not describe the same group of students, and the difference is large enough to matter to anyone comparing Saint Martin’s with another college. The last section before the bridge works through it.
University of Washington-Seattle Campus
The University of Washington’s Seattle campus is the largest university in the state with 31,942 undergraduates, and it admits 39% of applicants. It publishes no admitted score ranges, because it removed the SAT and ACT requirement permanently and does not use scores in review.
Cost of attendance is $32,446. In-state tuition and fees are $12,973 against $43,209 for non-residents, a gap of $30,236 that is identical at all three UW campuses.
UW is also the state’s medical school, through the WWAMI program covered later on this page. For a Washington resident it is the largest undergraduate institution, the most selective public university, and the operator of one of the two MD programs in the state at the same time.
Washington State University
Washington State University is a public research university in Pullman with 21,099 undergraduates, and its Elson S. Floyd College of Medicine in Spokane holds full accreditation from the Liaison Committee on Medical Education. It admits 87% of applicants and publishes no admitted score ranges.
Cost of attendance is $27,648. In-state tuition and fees are $13,391, the highest of any public university on this page, against $29,950 for non-residents. That $16,559 gap is the smallest among the eight publics, so WSU charges residents the most and non-residents comparatively little.
WSU is the second-largest institution here and the second of the two universities in this table that runs an MD program.
Central Washington University
Central Washington University is a public university in Ellensburg with 7,833 undergraduates. It admits 91% of applicants and publishes no admitted score ranges.
Cost of attendance is $28,816, with in-state tuition and fees of $9,417 against $27,526 for non-residents.
Eastern Washington University
Eastern Washington University is a public university in Cheney, near Spokane, with 6,222 undergraduates. Its cost of attendance of $24,478 is the lowest on this page, and its in-state tuition and fees of $8,586 are the lowest as well, against $25,959 for non-residents.
Eastern admits 91% of applicants and publishes no admitted score ranges. The spread between Eastern and the University of Puget Sound is 3.2 to one on cost of attendance, and both are four-year institutions a Washington student could reasonably apply to in the same cycle.
University of Washington-Bothell Campus
UW Bothell is a University of Washington campus in Bothell, northeast of Seattle, with 5,457 undergraduates. It admits 91% of applicants, against 39% at the Seattle campus, and it publishes no admitted score ranges.
Cost of attendance is $26,908, with in-state tuition and fees of $12,919 against $43,155 for non-residents.
The admit rates at the three UW campuses are the thing to notice. Seattle admits 39%, Bothell 91% and Tacoma 83%, while all three charge residents approximately the same tuition and non-residents the same $30,236 premium.
University of Washington-Tacoma Campus
UW Tacoma is a University of Washington campus in the city of Tacoma, with 4,185 undergraduates. It admits 83% of applicants and publishes no admitted score ranges.
Cost of attendance is $25,346, the second lowest on this page. In-state tuition and fees are $13,168 against $43,404 for non-residents.
Seattle Pacific University
Seattle Pacific University is a private Christian university in the Queen Anne neighborhood of Seattle with 1,762 undergraduates. It admits 83% of applicants and charges $56,826 in cost of attendance, with tuition and fees of $40,407.
Seattle Pacific is the one private college on this page that publishes no admitted score ranges, so it sits with the six publics at the bottom of the table for a different reason. Its tuition is also the lowest of the eight private institutions here, more than $5,000 below Saint Martin’s.
Why Do Washington's Public Universities Publish No SAT Scores?
Washington’s public universities publish no admitted score ranges because they no longer require a score, and the University of Washington states the position in its own words. Its admissions site says that “The University of Washington permanently removed the SAT/ACT requirement for incoming students.”
The word doing the work there is permanent. The page links to an announcement dated 11 June 2020, and the link’s own address refers to admissions beyond fall 2021, so this is a five-year-old decision rather than a pandemic measure still waiting to be reviewed. A family that assumes the requirement will come back is working from the wrong premise.
Six of the eight public universities in the table above follow the same pattern, and together they enroll 83% of the public university undergraduates on this page. The two largest universities in the state publish nothing because they look at nothing. Only Western Washington and Evergreen still report ranges.
In-article image 1 Shows: the sixteen institutions split into two columns by whether they publish admitted score ranges, with public and private marked Alt text: Washington colleges grouped by whether they publish admitted test score ranges, with public and private marked File name: washington-who-publishes-scores Size: 2760×1440
What this page does not claim is a mechanism. The reporting pattern is consistent with a coordinated change across the public system, but whether it rests on state law, an agreement among the public universities, or six separate institutional decisions is not established by anything published on their admissions pages. A reader who needs that answer should ask the Washington Student Achievement Council or the universities directly.
Two groups of applicants are exempt from all of this, and for them the test is required rather than optional. Home-schooled applicants and applicants from schools that do not issue letter or numeric grades must still submit SAT or ACT scores to UW. The exception within the exception is a home-schooled applicant with at least one year of college coursework, such as Running Start, who does not. A student in that position has no choice to weigh and should plan on testing.
International applicants submit TOEFL, IELTS or Duolingo results to demonstrate English proficiency. That is a separate requirement and should not be confused with the admissions test question.
Does the University of Washington Look at Test Scores?
UW’s own test scores page answers that question twice, and the two answers do not agree.
On one side, UW describes itself as technically test-optional. The page says that “when reading your application, the reviewers will not see your test scores, if provided.” One of its own statements goes further: “we will not be using test scores at all during the holistic review.”
On the other side, the same page says that “high test scores (1400 SAT/31 ACT or above) may be considered for a handful of students who may not otherwise be admitted.”
Those statements sit on one page and UW does not reconcile them. Both are quoted here as the university publishes them, and this page does not pick a winner.
What a student should do with that depends entirely on where his score lands. A student who would clear 1400 has a specific question to put to UW admissions, because the answer decides whether submitting is worth anything at all. A student who would not clear it has no decision to make, since the stated default is that reviewers never see the number.
Five States Where the Score Moved Out of the Decision
Washington is the fifth state in this series to move the test score away from the admission decision, and it has moved it furthest.
Oregon’s score did very little. Tennessee made it one of three alternatives for the HOPE Scholarship. Texas admits on class rank and uses the score as the fallback. Utah guarantees admission to its public system regardless of grade point average. Washington’s public universities do not look at the score at all.
The difference between Utah and Washington is the interesting part. Utah guarantees admission and its institutions still report admitted scores, so the number exists even where it does not decide anything. Washington’s flagship reports none, because it does not collect the number for review in the first place.
Virginia, the state covered immediately before this one in the series, runs the other way. Every Virginia school division is required to offer the SAT during the school day from 2026-27. One state has just put the test in front of every junior while a neighbor’s public universities have stopped looking at it, and both things are true at the same time. A student applying across that line needs to know which set of rules governs which application.
What Does the Washington College Grant Require?
The Washington College Grant requires income within published limits and nothing else academic. The eligibility criteria published by the Washington Student Achievement Council are Washington residency, a high school diploma or GED or equivalent, income within the limits, no bachelor’s degree or higher, no owed repayment on state financial aid, an application to an eligible Washington college or an approved apprenticeship sponsor, and enrollment in a financial-aid-eligible program. No test score appears, and no grade point average appears.
Income is based on the household income reported on 2024 taxes for the 2026-27 application year. The thresholds run by family size, with the full-award ceiling first and the ceiling for any award second. One person qualifies for a full award up to $43,500 and some award up to $72,500. Two, $57,000 and $94,500. Three, $70,000 and $117,000. Four, $83,500 and $139,500. Five, $97,000 and $161,500. Six, $110,500 and $184,000.
A family of four earning up to $83,500 qualifies for the full award, and a family of four earning up to $139,500 qualifies for some award. Those are not narrow ceilings, and a Washington family that assumed it earned too much to apply should check the chart before deciding. Awards between the two ceilings scale down from 60% of the full amount to 10%.
The maximum award is sized to the institution, and the ordering is the point. The University of Washington maximum is $13,203 and Washington State $12,700. Western Washington is $8,804, Evergreen $8,640, Central Washington $8,615 and Eastern Washington $8,035. A private four-year non-profit college is $6,476. A private four-year for-profit college is nothing at all. Community and technical colleges are $5,095, with applied bachelor’s programs at $8,134, Western Governors University Washington is $4,150, Northwest Indian College is $3,694, and a non-college-based apprenticeship is $2,548.
One part of the program has been cut. The $500 Bridge Grants paid from 2021-22 through 2024-25 are no longer available, and the Council attributes that to state budget reductions. A page that reported only the award amounts without the cut would be describing the program as it was rather than as it is.
In-article image 3 Shows: Washington College Grant maximum award by institution type beside the Virginia Tuition Assistance Grant by institution type Alt text: Washington College Grant and Virginia Tuition Assistance Grant maximum awards compared by institution type File name: washington-versus-virginia-grant-by-sector Size: 2760×1440
Washington and Virginia Built Opposite Grants
Washington’s grant and Virginia’s grant are mirror images of each other, and two neighboring pages in this series describe grants that point in opposite directions.
Washington pays most at its public research universities, approximately twice what it pays at a private non-profit college, and nothing at a for-profit. The public route carries the larger award.
Virginia’s Tuition Assistance Grant is available only at private non-profit colleges and pays nothing at any public university, including the three that charge residents more than almost any public university in the country. There the private route is the only one the grant reaches.
The practical advice reverses between the two states, and that matters to a student weighing colleges on both sides of the country. A Washington student comparing a public and a private option should price the grant into the public one. A Virginia student doing the same comparison should price it into the private one.
How Many UW Medical School Seats Go to Each State?
The University of Washington School of Medicine divides 280 entering seats among five states, and it states that the seats are allocated per state based on legislative funding. The program is called WWAMI, and the letters are Washington, Wyoming, Alaska, Montana and Idaho.
For the entering class of 2026 the seats run Seattle 100, with approximately ten a year reserved for the combined MD and PhD program, Spokane 60, Idaho 40, Alaska 30, Montana 30 and Wyoming 20.
Students complete their Foundations phase at a partner university in their own state. Those sites are Gonzaga University in Spokane, the University of Wyoming in Laramie, the University of Alaska Anchorage, Montana State University in Bozeman, and the University of Idaho. Clinical training then runs across more than 150 sites in the region, and the program operates 32 family medicine residency programs across the five states. WWAMI began with Alaska in 1971, and Wyoming joined in 1996.
Gonzaga is row three of the table above. A private Jesuit university on this page hosts the Spokane Foundations site for a public medical school, and Washington State’s own medical school is also in Spokane, so one city holds medical education run by two different universities.
The published acceptance rates are where the allocation becomes visible. UW publishes three-year averages by group: Wyoming 46.5%, Montana 30.3%, Idaho 27.6%, Washington 13.4%, Alaska 8%, and out-of-region 0.5%. Around 95% of the class on average are residents of the five WWAMI states.
A Wyoming resident’s published acceptance rate is approximately ninety times an out-of-region applicant’s. That is the clearest answer this series has found to the question of what residency is worth at a public medical school.
In-article image 2 Shows: the 280 seats divided by site with the published three-year acceptance rate printed beside each group and the out-of-region figure set against them Alt text: WWAMI medical school seats by state alongside published acceptance rates including the out-of-region figure File name: wwami-280-seats-and-acceptance-rates Size: 2760×1440
Out-of-region applicants are considered only for the Seattle class, which UW describes as far more competitive. The school does not accept international or Canadian applicants. Applicants with DACA status who are recognized as WWAMI residents for educational purposes are considered.
UW Also Publishes a Table That Does Not Add Up
The University of Washington publishes an applications, interviews, offers and matriculants table by state for the entering class of 2026, and parts of it cannot be correct. Pointing that out is a service to anyone who goes looking for it.
Two cells are impossible on their face. The Wyoming row shows 43 applicants and 136 interviews, and a school cannot interview more applicants than applied to it. The Alaska row shows 36 interviews and 37 offers.
Three of the column totals do not match the rows above them. The entering row sums to 276 against a stated 280. The applications row sums to 5,332 against a stated 5,242. The interviews row sums to 687 against a stated 784. Completed secondaries and offers made do both reconcile.
The applications discrepancy can be placed. UW publishes a separate ten-year table in which WWAMI applications for this class are 1,358 and out-of-region applications are 3,884, and those two figures sum to exactly the stated 5,242. The five state columns in the class table also sum to 1,358. So the stated total is the reliable number and the out-of-region cells are the overstated ones.
Alaska is the one group whose published acceptance rate cannot be squared with its own row at all. Thirty-seven offers against 67 applicants is approximately 55%, and the page reports a three-year average of 8%. Three-year averages differ from single-year figures, but not by that margin, and the Alaska row already contains more offers than interviews. The Alaska figures on that page should not be relied on.
So this page uses only the parts that hold. Those are the seat allocation, legislatively set and stated plainly, the approximately 95% regional share, the three-year average acceptance rates for the other five groups, and the rule that out-of-region applicants are considered only for Seattle. The funnel itself is not reproduced here.
Nine States, Nine Different Residency Rules
Washington is the ninth consecutive state in this series with its own residency rule, and it is the hardest to enter from outside and the most open from within. What counts as inside is five states rather than one, and an out-of-region applicant’s published acceptance rate is 0.5%.
Texas caps non-residents at 10% of every public medical school class by statute. Utah publishes a 132-seat table reserving 90 for residents and ten for non-residents who studied in Utah. North Carolina’s Brody School of Medicine bars applicants who are neither residents nor recent UNC System graduates. Tennessee’s UTHSC caps out-of-state admissions at approximately 10% as institutional policy. Oregon’s OHSU writes four criteria into a numbered policy. South Dakota’s Sanford grants residents an interview and reviews tied non-residents for one. North Dakota’s UND ranks a state degree inside a preference order. Vermont’s published policy governs tuition rather than admission.
There is a distinction in that list worth drawing for a reader arriving from one of those pages. Eight of those nine states tie standing either to residency or to where a student did his undergraduate degree, and the undergraduate half of that has come up on seven pages in this series. Washington ties standing to residency in a five-state region and barely to anything else. The question of which college a student attends is not the question Washington’s medical school is answering.
What Medical Schools Are in Washington?
Washington has three medical schools. Two award the MD and one awards the DO.
The University of Washington School of Medicine in Seattle is the MD program covered above, with Foundations sites across five states and 280 entering seats.
The Washington State University Elson S. Floyd College of Medicine in Spokane holds full accreditation from the Liaison Committee on Medical Education, granted in June 2021 after an extensive virtual survey visit in October 2020. It received preliminary status in October 2016 and provisional status in June 2019, so the full sequence took under five years. Its next full survey visit is scheduled for 2028-29, with a new institutional self-study launching in fall 2027. For a reader comparing this with the accreditation trouble reported on the Tennessee page, that is what an uneventful path through the process looks like.
The Pacific Northwest University of Health Sciences College of Osteopathic Medicine in Yakima is a private non-profit institution, and on 10 December 2025 it announced a full ten-year accreditation from the Commission on Osteopathic College Accreditation. PNWU describes that as the longest accreditation cycle the commission awards and says seven years is the national standard for osteopathic medical schools. The parent university is accredited by the Northwest Commission on Colleges and Universities.
Two of the three sit on campuses in the table above, since UW Seattle is row ten and Washington State is row eleven. The third is a standalone health sciences university in Yakima.
The standard caution applies with a Washington twist. Attending the undergraduate campus attached to a medical school helps with shadowing, research access and knowing the faculty, and it does not improve admission odds by itself. Washington’s real exception runs through residency in the WWAMI region rather than through where a student studied, a different exception from the one seven other states in this series describe. A reader who came here expecting the undergraduate-origin question will find Washington answering a different one.
Saint Martin's Reports Two Score Ranges That Disagree
Saint Martin’s University reports an ACT composite of 16 to 20 alongside SAT sections that sum to 1,025 at the lower end and 1,230 at the upper, and those two figures do not describe the same group of students.
One correction has to come first, because it applies to every comparison below. Adding a 25th and a 75th percentile from each section overstates a real composite by approximately 20 points at each end, since no single student sits at the same percentile in both sections. Every figure here carries that adjustment.
On the official concordance an ACT of 16 corresponds to approximately 890 on the SAT and an ACT of 20 to approximately 1,040. After the correction, the SAT figures sit approximately 115 points above the ACT equivalent at the lower end and approximately 170 points above it at the upper. An SAT total of 1,230 corresponds to an ACT of about 25, not 20.
The difference at the upper end is five ACT points, the distance between the middle of a typical applicant pool and the top of one.
Seven of the nine scoring institutions in Washington run the other way, with SAT sums sitting at or below their ACT equivalents once corrected. Evergreen sits approximately 125 and 107 points low, Puget Sound 130 and 40, Gonzaga 110 and 40, Pacific Lutheran 90 and 70, Western Washington 50 and 30, Whitworth 10 and 30, and Whitman 50 points low at the bottom and level at the top. Seattle University is the other institution reading high, at approximately 40 points at both ends.
That dominant direction is the pattern the Texas page described. In a state where most students take the SAT, the smaller group who take the ACT is self-selected and tests higher, so the ACT range reads above the SAT range at the same college. Washington follows it at seven of nine institutions.
Saint Martin’s breaks the pattern by a wide margin and in the opposite direction, which makes it a question about the reporting rather than about the applicants. Seattle University’s 40-point divergence is within the range ordinary variation explains. Saint Martin’s 170 points is not.
Both figures stay on this page and neither is reconciled here. A student considering Saint Martin’s should ask its admissions office which of the two describes the class he would be joining, and should not assume an ACT of 20 puts him in the middle of it.
What If Your Scores Are Below the Range You Want?
A Washington student whose score sits below the range he wants should start by working out whether the score matters to his list at all, because in this state the honest answer is often that it does not.
At six of Washington’s eight public universities the score is not a factor in admission, because those universities do not look at it. Those six enroll 83% of the public university undergraduates in the table above, and they include the largest and the most selective public institutions in the state. A student whose entire list is Washington public universities has no admission reason to prepare for either test.
Three groups of applications still turn on the number, and the table gives the distances for each.
Whitman College at 38% is the clearest case. It reports an admitted range of 670 to 740 in Reading & Writing and 640 to 740 in Math, it is the most selective institution in the state, and it does publish ranges. The University of Puget Sound at 72% and Seattle University at 77% are the next private colleges that both report scores and select among applicants, at 610 to 710 and 560 to 670 for Puget Sound and 620 to 710 and 580 to 720 for Seattle University.
Out-of-state applications are the second group, and Washington’s policy does not travel with a student. A Washington student applying to a college in another state is governed by that college’s requirements, and plenty of them still want a score.
The third group is the narrowest and the least discretionary. A home-schooled applicant to UW without a year of college coursework, or an applicant from a school that does not issue letter or numeric grades, must submit a score. For those students the question is not whether preparing is worth it.
Our students since 2008 have normally needed approximately 40 hours of focused work to move a score meaningfully and approximately 80 hours for a larger jump. An ACT point is worth approximately 25 to 30 SAT points, so those hours convert between the tests.
The close here is plainer than on most pages in this series. In Washington a test score is for private colleges, for out-of-state applications, and for a narrow set of applicants whose circumstances still require one. It is not for getting into the University of Washington, and the state grant does not ask for it either. Any page suggesting otherwise would be selling a Washington family something its own public universities have stopped buying.
A student who does fall into one of those three groups should sit a full timed test before committing the hours. Take a free diagnostic and work from a real score rather than an impression of one. Our guide on how to improve your SAT score sets out the method, and the conversion above makes it apply to the ACT.
Should a Washington Student Take the SAT or the ACT?
A Washington student should first settle whether to take either one, because that question has a real answer here and on most pages it does not.
For a student applying only to Washington’s public universities, the answer is normally no, with the home-school and non-graded-transcript exception covered above. For a student whose list includes private colleges in the state or any college outside it, the answer is yes, and the SAT is the sensible default.
Washington sits in SAT territory. All nine scoring institutions on this page report SAT sections, and the same nine report an ACT composite, so there is no college here that wants the ACT and not the SAT. That is also why the table above has no ACT column, since an ACT set identical to the SAT set adds nothing a reader cannot already see.
The concordance pattern points the same way. At seven of those nine colleges the reported ACT range reads higher than the reported SAT range, which normally means the ACT takers are a small self-selected group rather than a cross-section of applicants. A Washington student is comparing himself against a broader pool on the SAT.
The reasons to add the ACT are narrow. An application to a college in a state where the ACT dominates is the clearest one. The other is a student who sits timed practice tests of both and finds the formats genuinely suit him differently, which does happen, because the SAT’s adaptive sections and the ACT’s tighter timing reward different habits.
How to Read These Score Ranges
Every range on this page covers the middle 50% of admitted students who submitted that score. A quarter of admitted students scored below the lower figure, and the top quarter scored at or above the upper one.
Two things follow that students regularly get wrong. A score below the lower number does not rule a student out, because a quarter of the admitted class was there. And a score just above the lower number is weaker than it looks, because it sits at the bottom of the middle half rather than in the middle of it.
Three cautions apply to this page in particular.
Seven of the sixteen institutions publish no ranges at all, and the reason differs between them. For the six public universities there is nothing to compare against because they do not collect scores for review, so a student is not missing information he could otherwise have found. For Seattle Pacific the reason is not stated.
Saint Martin’s publishes two score sets that disagree by more than the summing correction explains, and the section above works through what that means for a student comparing it with anywhere else.
The usual test-optional caution needs a Washington qualification. At a college that is test-optional, students with stronger scores tend to submit them and students with weaker ones often do not, so a published range describes the submitters rather than a standard applied to everyone. At a university that does not see scores at all there is no submitting decision to describe. That is a different situation, and it affects six rows here. Our guides on what SAT score you need for college and test-optional colleges cover what that distinction means for a particular application.
Pre-Med Programs in Nearby States
Washington borders Idaho and Oregon, and British Columbia to the north.
Leaving Washington has a specific cost attached. The Washington College Grant does not travel, so a student who enrolls outside the state forfeits up to $13,203 a year at UW rates or up to $6,476 at a private Washington college.
The border runs the other way for medical school, and for Idaho students it runs twice. Idaho holds 40 WWAMI seats at the University of Washington, and the Utah page in this series established that Idaho also holds ten seats contracted at the University of Utah under Idaho House Bill 718, with a four-year Idaho practice requirement attached. So an Idaho student has two separate publicly arranged routes into medical school in two different states, 50 seats between them, without applying outside the region on his own. No other state in this series has two.
Montana holds 30 WWAMI seats and is covered in this series as well. Wyoming holds 20 and Alaska 30, and neither page is published yet, though both states sit inside the same allocation.
Our pages for Idaho, Oregon, Montana and Utah cover the colleges, costs and medical school rules in each.
Pre-Med Colleges in Other States
Every state page in this series follows the same format, with admitted score ranges, costs, admit rates and the state’s own medical school and scholarship rules. Our pre-med colleges by state index lists all of them.
We publish the same breakdown for pre-med programs in every state.
See pre-med colleges by state for the full list.

Glyn Caddell
Glyn Caddell holds a BS in Mechanical Engineering from NJIT and has been tutoring New York City students since 2008. He founded Caddell Prep in 2012 and is the author of Digital SAT Math Secrets: Lessons & Tricks to Quickly Improve to a Perfect 800 on the Math Test, which contains over 900 practice problems and is used in Caddell Prep’s SAT math classes. He is founding president of the Staten Island Technical High School alumni association and teaches every lesson on this site personally.
Finally, an SAT course that students actually understand
Every question has a video explanation. Not most — every one.
The on-demand Digital SAT course covers all 17 math topics and 15 reading and writing topics, with 5 full-length practice tests and a 100-point score increase guarantee. Keep access for the rest of high school. No subscription.
Want to Know What 5 Topics Will Improve Your SAT Score the Most?
Sample Feedback from our Diagnostic Test: