
In this video, we are going to look at graphs of exponential functions. After you finish this lesson, view all of our Algebra 1 lessons and practice problems.
Example of an Exponential Function Graph
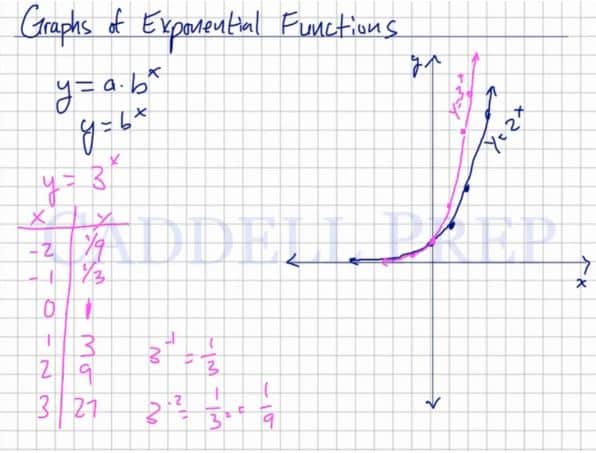
The graph of

grows steeper in a positive direction as x values increase after plotting points as shown in the video.
The graph of

grows steeper in a negative direction as x values increase after plotting points, and is a reflection over the x-axis of the first graph.
The graph of

grows steeper at a slower rate as x values increase after plotting points, and is a reflection over the y-axis of
Example of Graphs of Exponential Functions
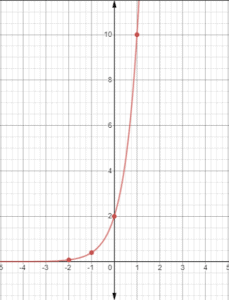
Example 1

When 


and 

The graph will be:
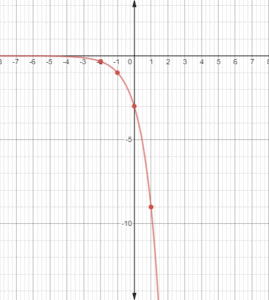
Example 2

When 


and

The graph will be:
Video-Lesson Transcript
Let’s go over graphs of exponential functions.
First of all, what is an exponential function?
Exponential function has a form of

Something that should stand out is that 


Let’s first look at functions that 
So, we’ll solve for
For demonstration purposes, let’s have
Let’s look at some specific ones.
When 


and 

The thing I want to point out is when
When we graph the positive exponent, it will not be a straight line. It increases at a much higher rate. It even curves up drastically.
When we graph the negative exponents, it will curve but will not touch the
Because even if the exponent is negative, it just changes to a fraction and not a negative number.
So this is the basic graph of an exponential fraction.
This is 
Let’s look at the graph of 
Let us have the same points here.
Let’s start with
When 


and 
This one is very steep on the positive exponents and very low on the negative exponents.
But still won’t touch the
Let’s graph 
Let me change the
Again let’s start with
When 
when 
and when 
If you look at it, it’s a mirror image of our first example.
When 
when 
and 

It will be very close to the
The negative will be reflected in the
Let’s look at another one.
Let’s have

So let’s start with 

When
when
and when 
Let’s go backward.
When
when
and when
Now let’s graph this.
Compared to the first example, this graph is reflected in the 
Think about this.
We have a constant that’s greater than
It will constantly raise on one side if the exponent is greater than
Whereas with the other one, we have a fraction. Which is less than one and raised to an exponent.
When multiplied by itself, it becomes smaller.
If you have a base that’s greater than
But if you have a base that’s less than