We will start the discussion about the measures of central tendency and dispersion by solving the mean. After you finish this lesson, view all of our Algebra 1 lessons and practice problems.
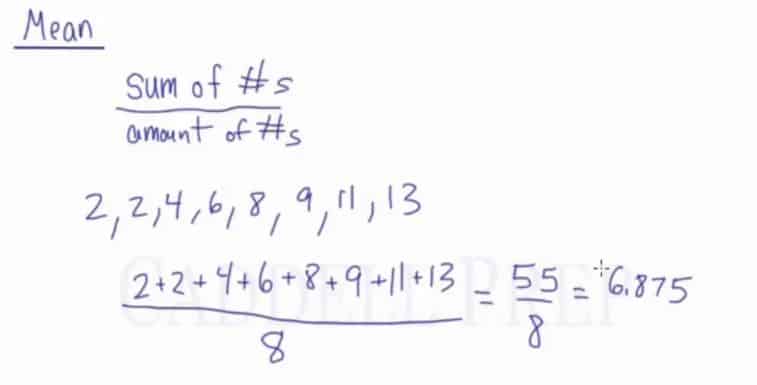
In this video, we are going to look at how to solve for the mean. The mean is found by adding up all of the numbers in a set and then dividing it by the total amount of numbers.
For example:
With the set {2, 2, 4, 6, 8, 9, 11, 13}, first, add up all the numbers, And then divide it by the amount of numbers, 8. So:
Examples of Mean
Example 1
What is the mean of the numbers and ?
First, add up all the numbers, And then divide it by the amount of numbers, .
So:
Example 2
Calculate the mean of the data set: 15,8,10,5,7
First, add up all the numbers, And then divide it by the amount of numbers, .
So:
Video-Lesson Transcript
The mean of a set of numbers is found by adding up all the numbers or the sum of the numbers and dividing it by the amount of numbers.
For example:
To find the mean, we would add these all up.
To find the mean, just add up all the numbers and then divide it by how many numbers there are.
Median
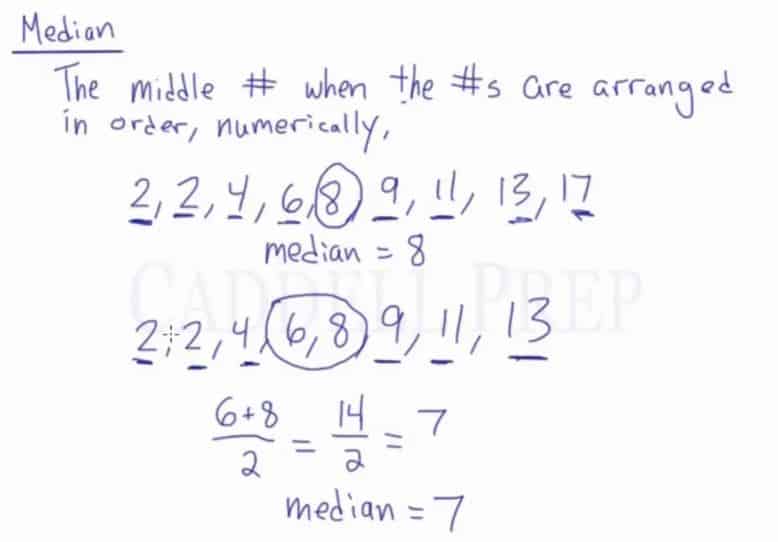
In this video, we are going to look at how to solve for the median. The median is the middle number when the numbers are arranged in numerical order.
For example:
With the set {2, 2, 4, 6, 8, 9, 11, 13, 17}, start crossing off numbers from each side, one by one, until you are left with just the middle number. In this set of numbers, 8 is the median.
In cases like {2, 2, 4, 6, 8, 9, 11, 13}, do the same thing by crossing off numbers from each side, one by one, until you are left with the middle number. In this case, however, we are stuck with two numbers in the middle, 6 and 8. Here, the median would be the number in between these two. The way to find that is to solve for the average of the two remaining numbers. So:
In this set of numbers, the median is 7.
Examples of Median
Example 1
3, 13, 7, 5, 21, 23, 39, 23, 40, 23, 14, 12, 56, 23, 29
First, we put those numbers in order
3, 5, 7, 12, 13, 14, 21, 23, 23, 23, 23, 29, 39, 40, 56
There are fifteen numbers. Our middle is the eighth number:
3, 5, 7, 12, 13, 14, 21, 23, 23, 23, 23, 29, 39, 40, 56
The median value of this set of numbers is .
Example 2
3, 13, 7, 5, 21, 23, 23, 40, 23, 14, 12, 56, 23, 29
First, we put those numbers in order
3, 5, 7, 12, 13, 14, 21, 23, 23, 23, 23, 29, 40, 56
There are now fourteen numbers and so we don’t have just one middle number, we have a pair of middle numbers:
The middle numbers are and .
To find the value halfway between them, add them together and divide by
The median is
Video-Lesson Transcript
The median is the middle number when numbers are arranged in order, numerically.
Put the numbers numerically from smallest to largest.
For example:
We’ll just look for the middle number by crossing one number from each side.
Now, is the middle number.
That’s four numbers to the left and four numbers to the right.
This works if there’s an odd number of values. Because there will be a middle number. Since there is the same amount of numbers on the left and the right.
Let’s see what happens if we have an even number of values.
Let’s do the same method that we did earlier. Cross out one number from the opposite sides.
We already crossed out three numbers from both sides but we’re left with two numbers which are .
In this case, the median is the number between these two.
The number between and is .
So, the median is .
But sometimes we have numbers that are more spaced apart or some decimals that are confusing.
In reality, the median is the average of two numbers that we’re left with.
For this set of numbers,
It’s very important to have the numbers in order then the median is the middle number.
If there’s an odd number of values, the median is one of the numbers.
If there’s an even number value, the median is the average of the two middle numbers.
Mode
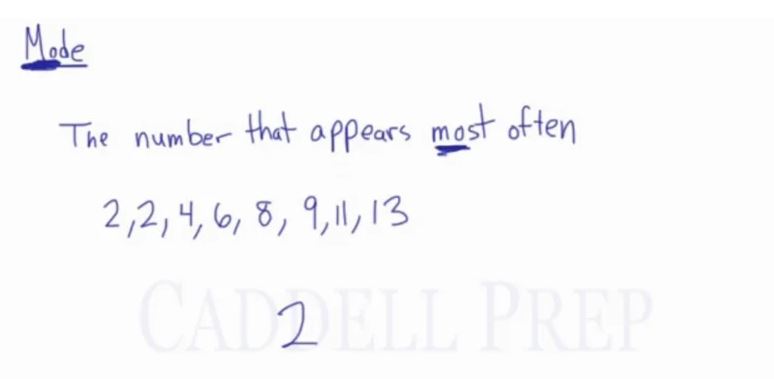
In this video, we are going to look at how to solve for the mode. The mode is the number that appears most often.
For example:
With the set {2, 2, 4, 6, 8, 9, 11, 13}, the mode would be 2 because 2 appears twice while all other numbers appear only once. Remember that the MODE is the number that appears the MOST.
Examples of Mode
Example 1
The Mode is 6 (it occurs most often).
Example 2
The Mode is (it occurs most often).
Video-Lesson Transcript
The mode is simply the number that appears most often.
If we have
the mode is just .
appeared twice.
All the other numbers appeared only once. It appeared most often than the others.
So, the mode is .
Remember, the mode is most.
Range
In this video, we are going to look at how to solve the range. The range is the largest number minus the smallest number.
For example:
With the set {2, 2, 4, 6, 8, 9, 11, 13}, the range would simply be 11 because 13-2=11. This set of numbers spans 11 integers.
Examples of Range
Example 1
The range of a set of numbers is simply the largest number minus the smallest number.
The lowest value is , and the highest is .
Therefore, a set of numbers spans integers
Example 2
The range of a set of numbers is simply the largest number minus the smallest number.
The lowest value is , and the highest is .
Therefore, a set of numbers spans integers
Video-Lesson Transcript
The range of a set of numbers is simply the largest number minus the smallest number.
Let’s have
The range is the largest number minus the smallest number.
So range is:
A set of numbers spans integers.
It goes from up to .
Calculate the Mean from a Frequency Table
In this video, we are going to look at how to calculate the mean from a frequency table.
For example:
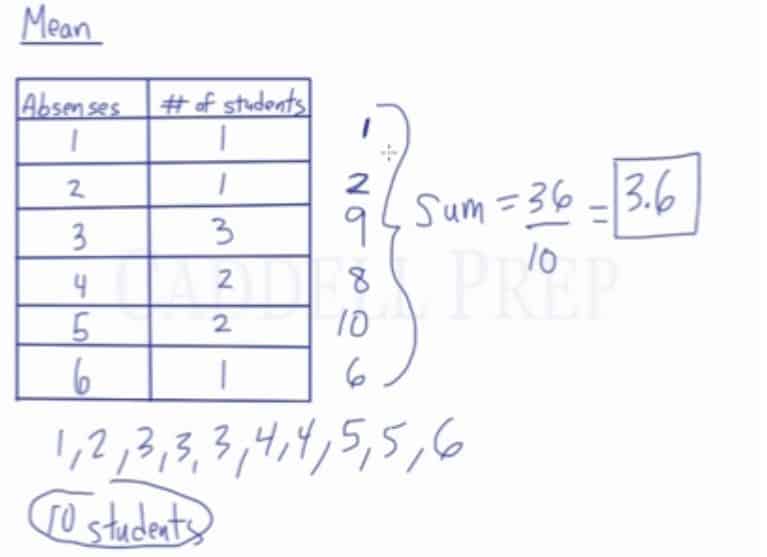
We can translate the table given in the video into a set of numbers. Since 1 student was absent once, we write 1 once. Since 1 student was absent twice, we write 2 once. Since 3 students were absent three times, we write 3 three times. And so on. This gives us a number set of {1, 2, 3, 3, 3, 4, 4, 5, 5, 6}. From here, we can solve for mean as usual. Add up the values, and then divide by the total amount of students. So:
The mean in this number set is 3.6.
Examples of Calculating the Mean from a Frequency Table
Example 1
First, write down the data from the table.
Now, add up all the numbers, and then divide it by the amount of numbers, .
Example 2
First, write down the data from the table.
Now, add up all the numbers, and then divide it by the amount of numbers, .
Video-Lesson Transcript
Let’s go over finding the mean if we’re given a table of values.
We’re given a table that shows different absences and how many students had each number of absences.
Using the table, we need to find the mean of the number of absences.
What we can do is write this all out
Now, we can add this all up then divide by the number of students.
But, there is a proven easier way.
Maybe we have a hundred more students. Numbers can get really big. And we don’t want to write a hundred set of numbers.
Instead, what we’re going to do find a total. Make a new column on the total number of absences on each one.
Now that we have a new column, we can find the sum of these. This is the same as when we add them all up individually.
And then let’s divide this by the number of students which is .
Again, we can figure out the mean by listing each of the absences and how many times they showed up. Adding them up then dividing by the numbers of students.
Or we can just find the total of each row of the table. Add those up but still divide by the number of students.
Calculate the Median from a Frequency Table
In this video, we are going to look at how to calculate the median from a frequency table.
For example:
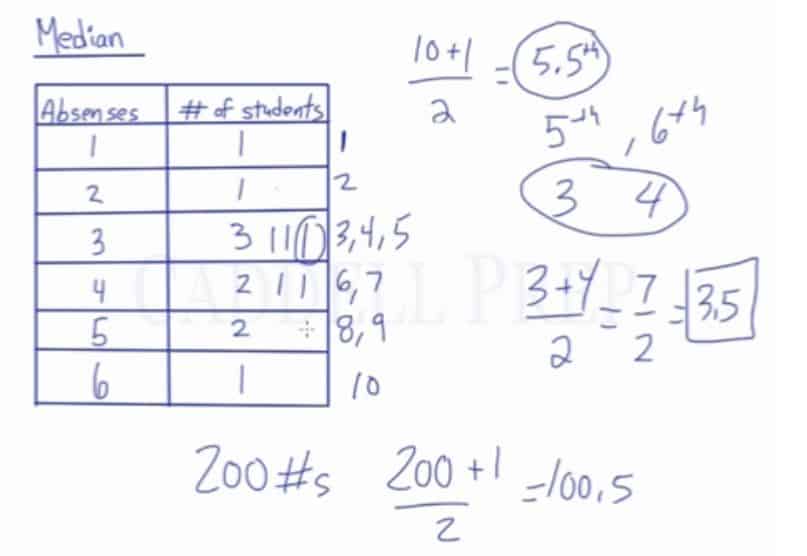
We can translate the table given in the video into a set of numbers. Since 1 student was absent once, we write 1 once. Since 1 student was absent twice, we write 2 once. Since 3 students were absent three times, we write 3 three times. And so on. This gives us a number set of {1, 2, 3, 3, 3, 4, 4, 5, 5, 6}. From here, we can solve for median as usual. Cross off numbers from each side, one by one, until you are left with just the middle number. In this set, we are left with 3 and 4 being in the middle. That means that we have to find the average of these two numbers. So:
In this set of numbers, the median is 3.5.
Examples of Calculating the Median from a Frequency Table
Example 1
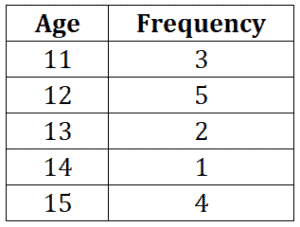
First, write down the data from the table.
There are fifteen numbers. Our middle is the eighth number
11, 11, 11, 12, 12, 12, 12, 12, 13, 13, 14, 15, 15, 15, 15
The median value of this set of numbers is .
Example 2
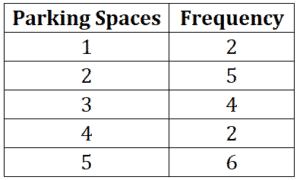
First, write down the data from the table.
There are nineteen numbers. Our middle is the tenth number
1, 1, 2, 2, 2, 2, 2, 3, 3, 3, 3, 4, 4, 5, 5, 5, 5, 5, 5
The median value of this set of numbers is .
Video-Lesson Transcript
In this lesson, we’ll go over finding the median if we’re given a table of data.
We have a table showing absences and the number of students had each number of absences.
We can solve for median by writing the data down.
We can cross out a number on opposite sides.
And we’re left with two middle numbers:
We have an even number of values.
Median is the average of two middle numbers.
It’s the number in between and .
That’s one way to find the answer.
Let’s make a side note and expand on the concept before we make a table.
Here, we have ten numbers.
This means that the median is the five-point fifth number.
Which means it’s between the fifth and sixth number.
So we have to find the middle of the fifth and sixth number in the list.
Let’s say we have four numbers.
So we’ll have
The median is the two point fifth number.
So, we have to get the average of the second and third number.
Let’s say we have
Now, we have five numbers.
If we do the same as above, this will happen
The median is going to equal this:
This is the third number.
One more example.
Median is the fourth number from the list.
If we want to know what the median in order, we just have to add one to the total the number of values in the list then divide by two.
Let’s go back to the table.
There were ten students.
The median is the five-point fifth number.
In order, we have to find out what is between the fifth and sixth number.
The fifth number in the list is and the sixth number is .
We just have to find the average of these two.
This method will help us the most when there are many numbers on the list.
Let’s say we have two hundred numbers and we need to find the median.
So, all we have to do is
So, our median is the number between the one hundredth and one hundred and oneth number.
We don’t need to write all the numbers and cross out from opposite directions until we come up with the middle number on the list.
Calculate the Mode from a Frequency Table
In this video, we are going to look at how to calculate the mode from a frequency table.
For example:
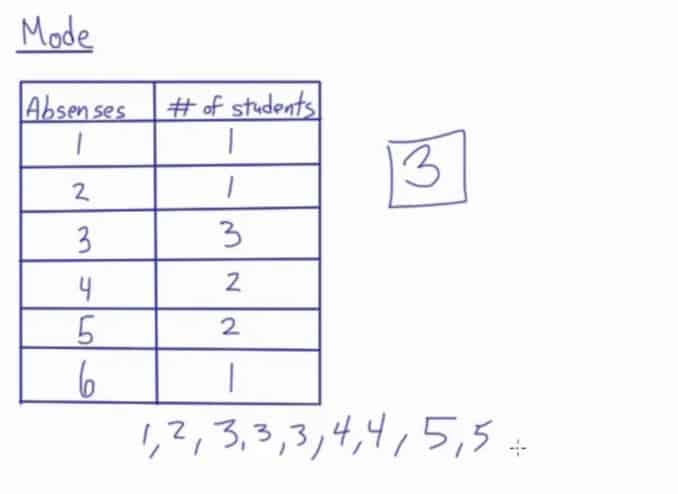
In this table, 3 absences appear 3 times. That is more than any other number of absences in the table. By simply analyzing the table, we can determine that the mode is 3.
Examples of Calculating the Mode from a Frequency Table
Example 1
In this table, the age appeared times. Therefore, the mode is
Example 2
In this table, the parking spaces appeared times. Therefore, the mode is
Video-Lesson Transcript
Let’s go over finding the mode when we’re given a table.
Here, we have a table showing absences and how many students had each of those quantities of absences.
To find a mode is probably the easiest to do from a table because the quantities are already here.
For each of the absences, we can see how many times it showed up.
Well, absences showed three times.
That’s more than any absence.
So, the mode is .
If we want to write it down, it will look like this:
Here, we can see that showed up the most because it showed up three times.
So, is the mode.
Calculate the Range from a Frequency Table
In this video, we are going to look at how to calculate the range from a frequency table.
For example:
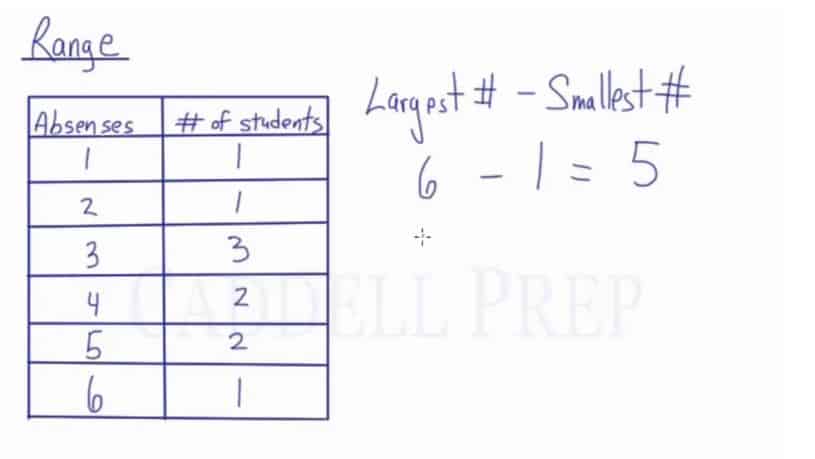
To find the range of absences, just simply subtract the largest number minus the smallest number. Based on this table, we can clearly see that the largest number of absences is 6 and the smallest number of absences is 1. Therefore, 6-1=5. The range is 5.
Examples of Calculating the Range from a Frequency Table
Example 1
The range of a set of numbers is simply the largest number minus the smallest number.
The lowest value is , and the highest is .
Therefore, a set of numbers spans integers
Example 2
The range of a set of numbers is simply the largest number minus the smallest number.
The lowest value is , and the highest is .
Therefore, a set of numbers spans integers
Video-Lesson Transcript
We’ll look at finding the range if we’re given a table.
Here, we have a table showing absences and how many students had each of those quantities of absences.
To find the range, we just have to look for the largest number minus the smallest number.
After you finish this lesson, view all of our Algebra 1 lessons and practice problems.


 and
and  ?
? .
.

 .
.


 .
. and
and 


 is the middle number.
 .
. and
and  .
.


 (it occurs most often).
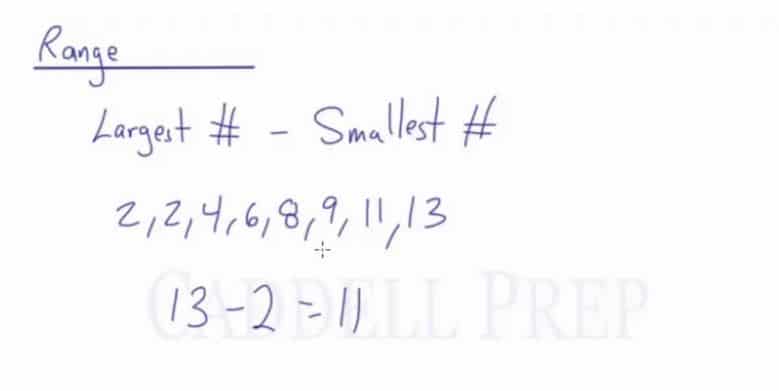

 , and the highest is
  .
.

 .
.
 integers

 integers.


 .
.


 .
.


 .
.


 .
.


 , and the highest is