In this video, we are going to learn about the differences between theoretical and experimental probability. After you finish this lesson, view all of our Algebra 1 lessons and practice problems.
Let’s use rolling a dice as an example. Use P to represent probability.
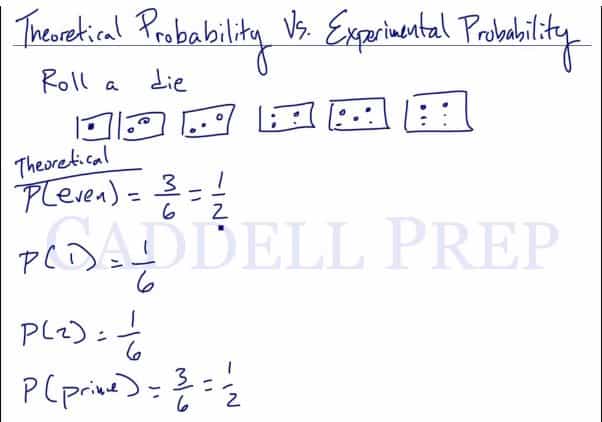
Theoretical: The ratio of possible ways that an event can happen to the total number of outcomes.
\frac{3}{6}=\frac{1}{2}")
Theoretically, the probability of rolling an even number on a dice ranging from 1 to 6 would be  , or simply just
  .
.
\frac{1}{6}")
To roll a one, the theoretical probability would be  .
.
On a larger scale, it also means that theoretically, the probability
of rolling one number is the same.
Experimental: The ratio of the number of times an event happens to the total number of outcomes.
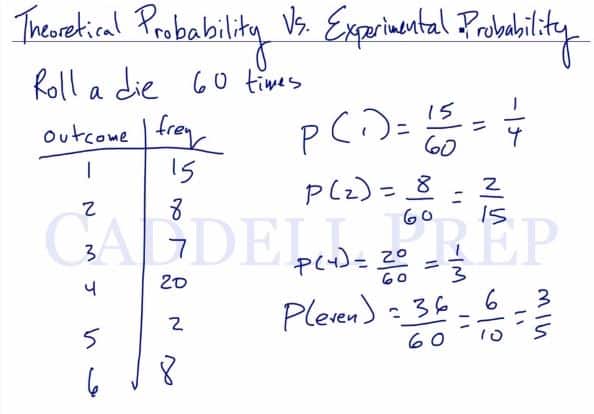
Let’s use the following table to find the experimental probability after rolling a dice 60 times.
| Outcome | Frequency |
| 1 | 15 |
| 2 | 18 |
| 3 | 7 |
| 4 | 20 |
| 5 | 2 |
| 6 | 8 |
\frac{8+20+8}{60}")
Experimentally, the probability of rolling a even number would be the sum of the frequency for even outcomes to the total number of trials.
\frac{36}{60}") , or simply just
, or simply just 
\frac{15}{60}")
To roll a one, the experimental probability would be  .
.
Note that the probability of rolling each number is different, as well as when compared to the theoretical probabilities.
Examples of Theoretical vs. Experimental Probability
Example 1
Theoretical: The ratio of possible ways that an event can happen to the total number of outcomes.
=\dfrac{1}{2}")
=\dfrac{1}{2}")
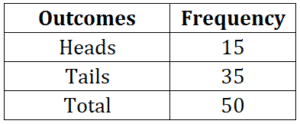
Experimental: The ratio of the number of times an event happens to the total number of outcomes.
Experimental probability of landing on heads= 
Experimental probability of landing on tails= 
Example 2
Theoretical: The ratio of possible ways that an event can happen to the total number of outcomes.
=\dfrac{1}{6}")
=\dfrac{1}{6}")
=\dfrac{1}{6}")
=\dfrac{1}{6}")
=\dfrac{1}{6}")
=\dfrac{1}{6}")
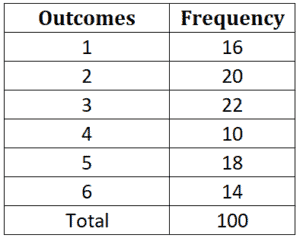
Experimental: The ratio of the number of times an event happens to the total number of outcomes.
a. Rolling a  (use the table)
=\dfrac{22}{100}=\dfrac{11}{50}")
b. Rolling a number less than 3 (use the table)
=\dfrac{16+20}{100}=\dfrac{36}{100}=\dfrac{9}{25}")
Video-Lesson Transcript
Let’s go over theoretical and experimental probability.
In a die, there are six faces with dots ranging from one to six.
We have six different side and six different outcomes.
If we want to see the probability of rolling an even number, just take a look at my drawing. There are three even numbers out of a possible six numbers.
 = \dfrac{3}{6} = \dfrac{1}{2}")
So, the probability of having an even number is  .
.
This is theoretical.
The probability of rolling a one is:
 = \dfrac{1}{6}")
While, the probability of getting a two is
 = \dfrac{1}{6}")
And the probability of getting a prime number is
 = \dfrac{3}{6} = \dfrac{1}{2}")
These are all theoretical.
We assume that when we roll a die, there is an equal chance of all the sides
coming out.
So, this is just the number of the favorable outcomes over the total outcomes.
This is different from experimental probability.
Experimental probability is based on experiment and data.
If we roll a die theoretically where we have an equal chance of getting all the
side, we will have the same frequency.
So, if we roll a die sixty times,
we will have  ,
,  times,
we’ll have  , times,
then we will have , times,
we’ll have  , times,
we will have  , times,
and we will have  , times.
That’s theoretical. We expect it to be evenly distributed.
But that’s not always the case.
For whatever reason, when we roll a die sixty times,
we got ,  times,
then we got ,  times,
we got ,  times,
and then we got ,  times,
we got , times,
and we got , times.
Things didn’t go as planned.
For whatever reason, came out a lot more than the other numbers. came out times.
It wasn’t evenly distributed.
Experimental probability is based on these outcomes.
Based on our experiment, we can say that we can roll a rather than get a . Since came out many times as compared to .
If we want to know the probability of getting a :
 = \dfrac{15}{60} = \dfrac{1}{4}")
which is a lot different from the way we had before.
The probability of getting of a is
 = \dfrac{8}{60} = \dfrac{2}{15}")
which is a lot less than  that we had earlier.
The probability of getting a is
 = \dfrac{20}{60} = \dfrac{1}{3}")
If you want to know the experimental probability of rolling an even number:
 = \dfrac{36}{60} = \dfrac{3}{5}")
Theoretical probability is based on the size equally distributed.
However, the experimental probability is based on data from actually doing the experiment and its outcome.
Make sure that when you do an experimental probability, you base it on frequency as occurred to the total times it was tried.