Part 1
In this video, we are going to graph rational functions.
For example: 
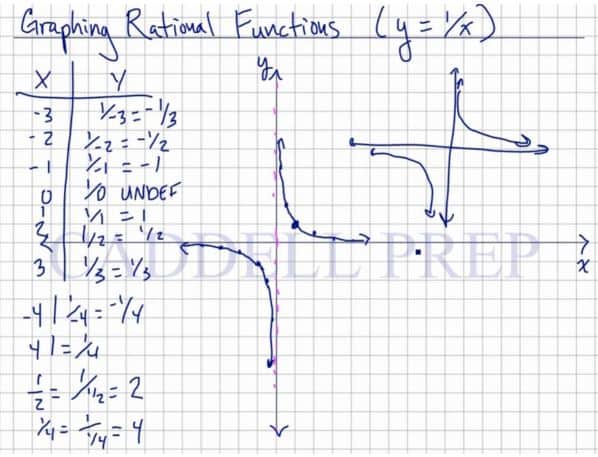
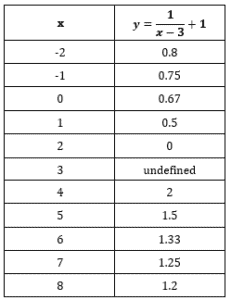
Let’s first make a table listing the x and y values
| x | y |
 |
 |
 |
 |
 |
 |
 |
 |
 |
 |
 |
 |
 |
 |
Plot the coordinate points on a coordinate plane. Note how there are no points on the x-axis.
Video-Lesson Transcript
Let’s go over how to graph rational functions such as  .
.
Let’s look at some values.
When  then
then  ,
,
when  then
then  ,
,
then  then
then  ,
,
when  then
then  ,
,
when  then
then  ,
,
then when  then
then  ,
,
and when  then
then  .
.
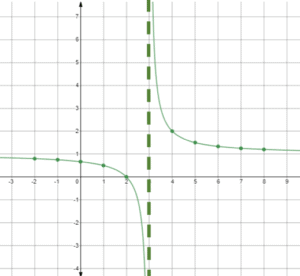
Now, we’re ready to plot.
Zero doesn’t exist. Let’s just make a note that there’s an asymptote there for the point in the function that doesn’t exist.
An asymptote is here so we’ll know that when we approach it, it doesn’t really exist.
Let’s continue plotting.
We came up with two lines that don’t touch the  -axis and
  -axis. Because these represent the asymptotes.
No matter how relatively close they are, they won’t touch the and axis.
This is the basic line graph of our discussion.
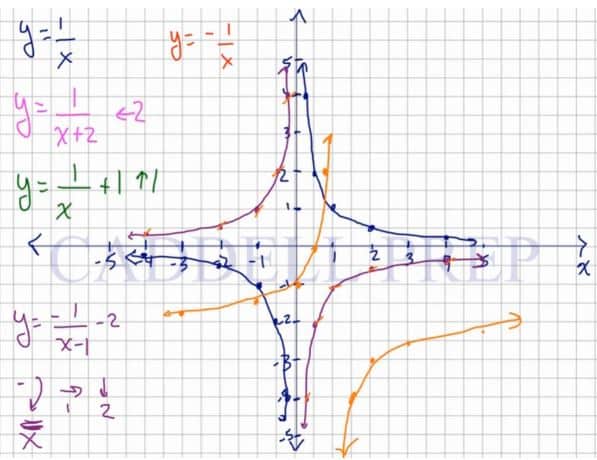
Let’s go over some rules in transforming functions.
- If we add a number to a
 value, we’re going to move to the left by that number.
 - Next, if we subtract from , we’ll move to the right by that value.
- If we add a number to a function, it’s going to move the line up by that number.
- Then, if we subtract a number from the function, it’s going to move it down by that number.
- If you multiply a function by a positive number, it’s going to get each value greater by that value.
To demonstrate this. let’s say we have a function  .
.
When we’re given  , the values of are also multiplied by . The line will be longer and skimpy.
If we’re given  , then values of are going to be multiplied by . Line will become wider and shallow.
Now, if multiplied by a positive number greater than , it’s going to stretch out.
And if multiplied by a positive number between and , it’s going to stretch down.
6. If you multiply it by a negative number, it’s going to flip it. The same shape but upside down.
Now, let’s apply this in function rule.
Here’s a graph.
For example:

Since we added a number to , we’ll move to the left by the same number of spots which is .
The asymptote where the two lines don’t pass will also move by spots.
Let’s do

Now, we’re going to move up by spot.
Notice that the horizontal asymptote also moved up by .
But the vertical asymptote didn’t move.
Now, let’s take a look when we have negative.

Here, everything is negated. So our line will flip.
Notice the asymptotes – both vertical and horizontal – didn’t move.
Let’s look at a more complicated one that involves everything.

Negative means lines will flip. The line will move right by spot and move down by spots.
Now, let’s look at the asymptotes. Same as our functions, it also moves right by spot and moves down by spots.
But this is just step number one.
Because our function is negative, we have to flip it.
Part 2
In the second video, we are going to graph rational functions with transformation.
Keep the following in mind during transformation:
| Add # to x | Moves Left |
| Subtract # from x | Moves Right |
| Add # to Function | Moves Up |
| Subtract # from Function | Moves Down |
| Multiply Function (Positive) | Each y-value is multiplied |
| Multiply by Function (Negative) | Each y-value is multiplied, flipped over y-axis |
For example:
A transformation from  to
to  , each point of the latter graph will be located two units above each point of the prior graph.
A transformation from to  , each point of the latter graph will be located across the x-axis compared to each point of the prior graph.
Examples of Graphing Rational Functions
Example 1

First, make a table listing the x and y values
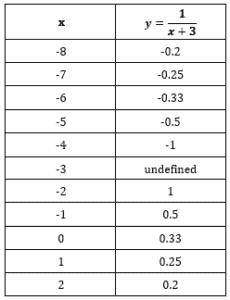
Plot the coordinate points on a coordinate plane.
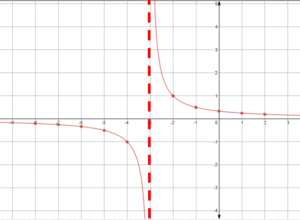
As you can see, the line was moved to the left by spots
Example 2

First, make a table listing the x and y values
Plot the coordinate points on a coordinate plane.
As you can see, the line was moved to the right by spots and up by spot
Video-Lesson Transcript
Let’s look at a more difficult one.
This negative means we have to flip the lines over the -axis.
Important to note is that we have to take the negative first into consideration before we move left or right.
This just takes care of the negative there.
You might recognize this, as we previously graph  .
.
Now, let’s take into consideration the and .
The line will move right by spot and move down by spots.
Now, let’s look at the asymptotes.
The new asymptote followed the function and move right by and move down by .
The transformation for also applies to other functions as well.
For example:
^{2} + 3")
Here, we’ll move to the right by and up by .
Next,

Remember, we have to do the negative first. So, we’ll flip the line.
This is just our intermediate function, where we only took the negative into account.
Now, let’s do  .
.
We’ll move everything by spots.
Keep in mind our rules:
1. If we add a number to a value, we’re going to move to the left by that number.
2. Then, if we subtract from , we’ll move to the right by that value.
3. Next, when we add a number to a function, it’s going to move the line up by that number.
4. If we subtract a number from the function, it’s going to move it down by that number.
5. When you multiply a function by a positive number, it’s going to get each value greater by that value.
6. Lastly, if you multiply it by a negative number, it’s going to flip it. The same shape but upside down.
Let’s do one more example.

Negative’s going to flip it. And is going to make the values of what it originally is.
Now, it flipped and became a little bit wider than the original.
After you finish this lesson, view all of our Algebra 1 lessons and practice problems.