In this video, we will learn how to graph a function. To graph a function, you have to select x-values and plug them into the equation. Once you plug those values into the equation, you will get a y-value. Your x-values and your y-values make up your coordinates for a single point. Keep plugging in x-values to get coordinates to plot more points on the graph, and then you will see your graphed function once the dots are connected. Be sure to label your graph. After you finish this lesson, view all of our Algebra 1 lessons and practice problems.
Example of Graphing a Function Rule

 - 4 = -2")
 - 4 = 0")
These coordinates would look like this:
") and
and ")
Video-Lesson Transcript
Example 1

Let’s pick the x values then solve for its corresponding y values.
We have the values of x as  .
.
Our function is .
So let’s substitute the values of  for us to have the values of
  .
.
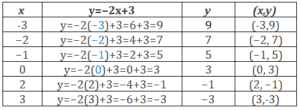
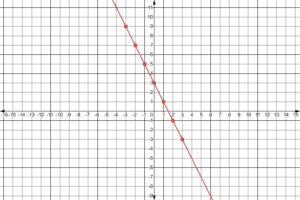
Now, let’s graph the coordinates.
Example 2

Let’s pick the x values then solve for its corresponding y values.
We have the values of x as  .
.
Our function is .
So let’s substitute the values of for us to have the values of .
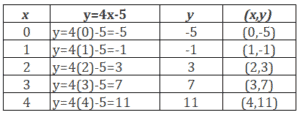
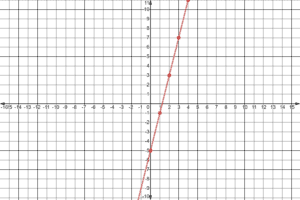
Now, let’s graph the coordinates.
Let’s go over graphing a function rule.
For example:

Let’s pick the values then solve for its corresponding values.
We have the values of as .
Our function is .
So let’s substitute the values of for us to have the values of .
If 
then  - 4")
so 
If 
then  - 4")
so 
If 
then  - 4")
so 
If 
then  - 4")
so 
If 
then  - 4")
so 
If 
then  - 4")
so 
And lastly if 
then  - 4")
so 
So let’s also write our and coordinates
")
")
")
")
")
")
")
Now, let’s graph this.
After connecting the points, it’s important to put arrows on both ends of the line segment.
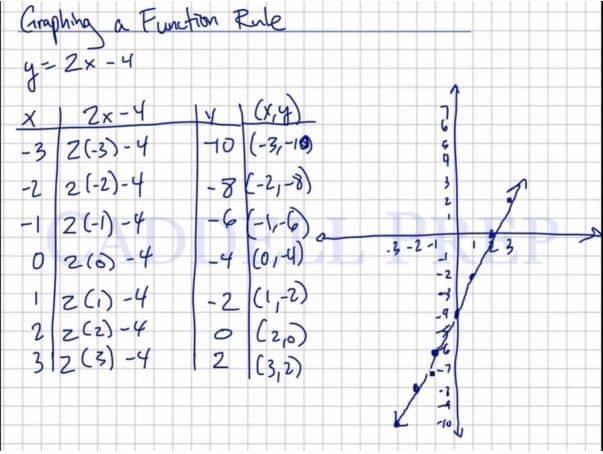
Because we know that these points are the points in the function. But they are not the only points.
The function can move on both ends which the arrows represent.
And then label the graph.