In this video, we are going to look at exponential growth. After you finish this lesson, view all of our Algebra 1 lessons and practice problems.
^x")
For a graph to demonstrate exponential growth, the coefficient, a, must be positive, and the base of the exponent, b, must be greater than 1. The graph will follow a path that curves upward to the right. These graphs grow by a factor, as opposed to a constant value.
For example:
The graph of
^x")
curves upward after plotting points as shown in the video, and demonstrates exponential growth. This graph grows by a factor of 1.2.
When comparing a linear graph to an exponential growth graph, as more time goes on, the exponential growth tends to grow by larger quantities than the linear growth.
Examples of Exponential Growth
Example 1
The population of Greendale in  was estimated to be
  people with an annual rate of increase of
  . What will be the estimated population in year 2020?
After one year the population would be ") .
.
By factoring, we have ") or
or ") .
.
In year or initally, the population is  .
.
Then in year  , we have
  ,
,
year  , we have
  ,
,
in year  , we have
  ,
,
and in year  , we have
Therefore, the estimated population in the year is .
Example 2
If we have  deposited in the bank, and receive a
  interest annually. How much is the money in the
  rd year?
After one year the money will be ") .
.
By factoring, we have ") or
or ") .
.
In year  or initally, the money deposited is
  .
.
Then in  st year, we have
  ,
,
 nd year, we have
  ,
,
and in the rd year, we have 
Therefore, the money will be in rd year.
Video-Lesson Transcript
Let’s go over exponential growth.
The basic exponential function is


In exponential growth,  is always positive and
  .
.
If we look at the exponential growth graph, it will look like this.
Where each point is some fact greater than the next one.
For example:


then ^x")
Let’s see what this table looks like.
Let’s get a financial calculator to solve this.
So when  ,
,  ,
,
when  ,
,  ,
,
and when  ,
,  .
.
So the question is how do we get to these points?
Each time we’re just multiplying by .
So  , then
  , and then
  .
.
The next point is  .
.
Each time we multiply by . It multiplies by the constant  .
.
It’s not going up by a said amount. Here, the increase in  value is increasing in itself.
Whereas when we have a linear graph, it goes up at a constant rate each time.
Here, the jump in values are linear. The increase or decrease is the same in the entire time.
Just to recap, exponential growth has  as an exponent for it to be exponential, growth is a positive number greater than .
Very important:
Exponential growth grows by a factor.
So you keep on multiplying by a certain number to get a new value.
An example is a compound interest. Each month money may grow by  or some value compared to the previous one.
Whereas, linear growth grows by a constant value.
So instead of growing by a certain percentage, it will always grow by a certain amount.
For example, your money grows by  each month.
On the other hand, exponential growth may grow your money depending on the percentage.
Let’s look at an example:
Two Savings Accounts
 initially
a)  annually
b) annually
Let’s start with savings account b where money grows by annually.
Year  or initally, we have .
Then year , we have  ,
,
year , we have  ,
,
on year , we have  ,
,
year  , we have
  ,
,
then year  , we have
  ,
,
year  , we have
  ,
,
year  , we have
  ,
,
and year  , we have
  .
.
Now, let’s do savings account a where it grows annually.
Year or initally, we have .
Then year , we have  ,
,
year , we have  ,
,
year , we have  ,
,
and on year , we have  .
.
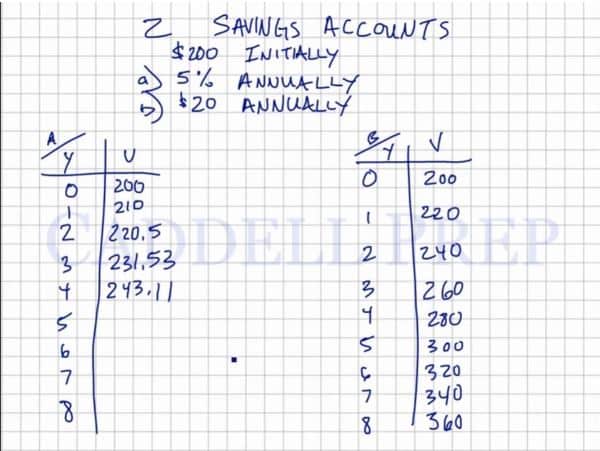
Take note that the previous amount grows by . So we add the increase to the previous amount to get the new value.
Savings account b still looks further ahead.
Let’s make an equation for this.
^x")
Let’s compare it to the one that grows every year.
So far, we have no increase of more than .
From year  to
to  , we have a
  growth. But still not there yet.
After  years, we have an
  growth.
At year  , the difference is
  .
.
From year  to
to  , it grew by almost
  .
.
From year  to
to  , it grew by
  .
.
It grows slower, depending on the numbers you’re comparing it to. But after a said amount of time, it will grow at a much greater rate. And will eventually pass the other one.
What if we have a increase?
So right off the bat, it improved by  .
.
Then at year , it grew by more than .
From year  to , it improved by
  .
.
The compound interest or exponential growth will quickly pass the linear growth.