Give us a call (917) 722-0677

You can excel with Caddell!

1. A B B C B D C D A C B C E

What is the frequency of the letter D?

Question 1 of 10

2. 93,101,102,83,92,88,82,81,109,97,90,80,101,99,88

Which of the following sets of intervals could be used for a frequency table to most accurately represent the data?


Question 2 of 10

3. 93,101,102,83,92,88,82,81,109,97,90,80,101,99,88

Which histogram accurately represents the data above?


Question 3 of 10

4. 4Which two times are closest in the number of teens?

Question 4 of 10

5. 4Which histogram accurately represents the data above?

Question 5 of 10

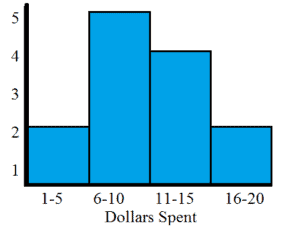
6. Jon ate out for lunch for two weeks. The histogram below shows how much meals usually cost. Which set of data corresponds with the histogram?

6

Question 6 of 10

7. What is the cumulative frequency of math scores from 50-100?

7

Question 7 of 10

8. What is the frequency of the color red?

8

Question 8 of 10

9. 97,80,67,95,100,83,78,84,97,92,52,61,95,92,79,60,86,83,97,90

Which frequency table accurately depicts the data?

Question 9 of 10

10. 97,80,67,95,100,83,78,84,97,92,52,61,95,92,79,60,86,83,97,90

Which histogram correctly depicts the data above?


Question 10 of 10


Go back to the Algebra 1 Page