In this video, you will learn how to do a translation graphically and then use the coordinates.
Translation: A slide of a slide of a shape on a coordinate plane.
We can move a shape upward, downward, leftward, or rightward.
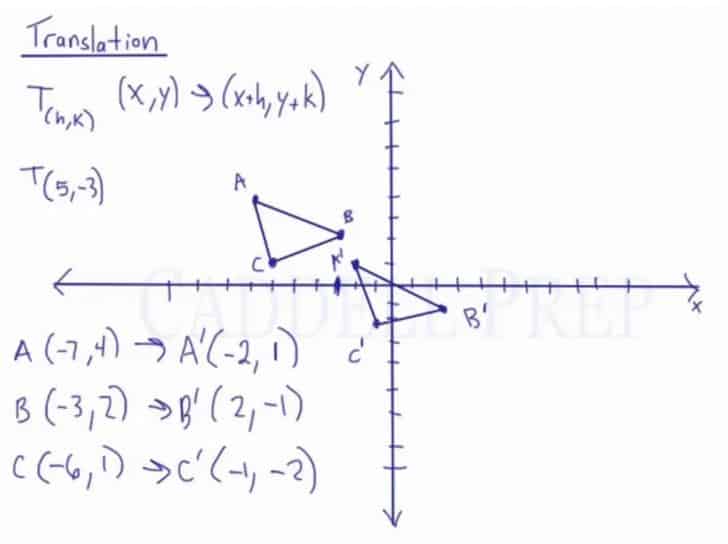
The notation for translation is T(h, k) where T is the translation, h is the change in the x-axis, and k is the change in the y-axis.
Applying the translation to the coordinate plane, it would be
(x, y)  (x+h, y+k)
For example:
A(-7,4)
B(-3,2)
C(-6,1)
with the transformation of T(5,-3)
Simply combine the values of either the x or the y-axis with the translation notation, and the coordinate points of the image are shown.
A(-7,4) A'(-7+5,4-3) A'(-2,1)
A(-3,2) B'(-3+5,2-3) B'(2,-1)
A(-6,1) C'(-6+5,1-3) C'(-1,-2)
Furthermore, to find the coordinate points of the image with the given pre-image graphically, simply move the points of the pre-image around the plane to reach the image.
Video-Lesson Transcript
Translation is just a slide of a shape.
We can move this entire shape to the right and up. We can move it to the right and down. Or we can go left and down or left and up. Maybe just up, or just down, or just left, or just right.
The way we denote translation is the capital letter  and then two numbers, we’ll call them
  and
and  . One number is the change in
  direction which is and the other number is the change in
  direction which is the .
If we have and coordinates, we’ll just have to add whatever is the value of and .

For example, we have
}")
This means we’re moving to the right by  because we’re adding to the values. Then move down by
  since we’re going to add
  to the values.
Now, let’s do this.
First using the coordinates and then using the actual graph.
First, let’s write down the coordinates.
")
")
")
Then let’s figure out what the image of this would be.
We’re going to add to the values and to values.
")
")
")
These are the new coordinates of our image based on this rule.
Next, let’s do this graphically.
means move to the right by and then means move down by .
Move all the points  graphically. Then let’s draw the triangle.
Now, let’s see the coordinates according to the graph.
As a result, we have these
You can pair these with the coordinates we got by using the rule.
So, you can see that they’re exactly the same.
To find the image, we can do it either graphically or with the rule.