Give us a call (917) 722-0677

You can excel with Caddell!

1.
100 men and 100 women were asked to pick whether they prefer to have a dog or a cat as a pet. The results of the survey are shown in the table above.

What percentage of men prefer dogs?
2.
100 men and 100 women were asked to pick whether they prefer to have a dog or a cat as a pet. The results of the survey are shown in the table above.

What percentage of people who prefer cats were women?
3.
100 men and 100 women were asked to pick whether they prefer to have a dog or a cat as a pet. The results of the survey are shown in the table above.

What percentage of the people surveyed were men who prefer cats?
4. A survey was conducted among a randomly chosen sample of U.S. citizens about the annual income that U.S. citizens earn. The table below displays a summary of the survey results.
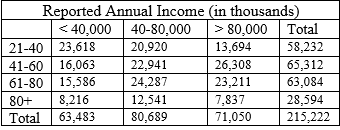

According to the table, for which age group did the greatest percentage of people report that they earn over $80,000 a year?
5. A survey was conducted among a randomly chosen sample of U.S. citizens about the annual income that U.S. citizens earn. The table below displays a summary of the survey results.


Of the 21-40 year olds who reported that they earn between $40,000 and $80,000 a year, 500 people were selected at random to do a follow-up survey where they were asked which field they work in. There were 156 individuals who reported working in a business field, 146 individuals who reported working in a STEM field, and the remaining 198 individuals reported working in various other fields. Using the data from both the follow-up survey and the initial survey, which of the following is most likely to be an accurate statement?




Note: Do not move on until the activity above has been completed and submitted.