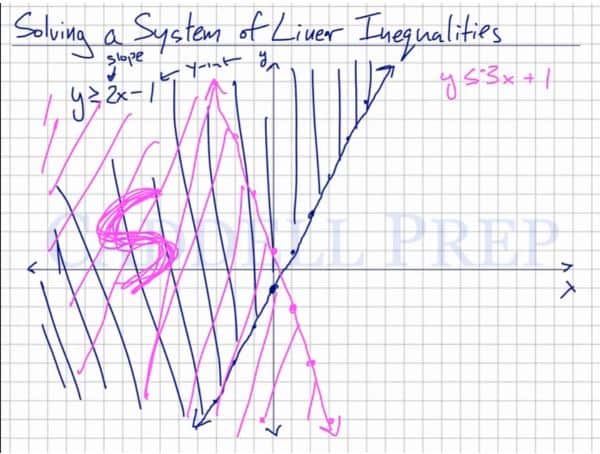
Here is another set of examples to show you how to solve a system of linear inequalities. After you finish this lesson, view all of our Algebra 1 lessons and practice problems.
In this example, we have the two equations,  and
and  .
.
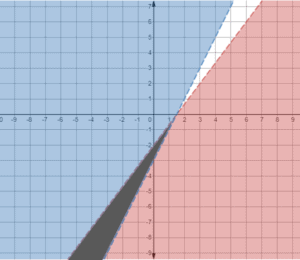
Both of these equations have a line under their symbols, which means that both equations include the lines. The lines are both solid.
For the first equation, , the symbol  (greater than or equal) means that the area above the line will be shaded. As for the second equation, , the symbol
  (less than or equal) means that the area below the line will be shaded.
This creates an area where the areas of the two equations overlap. This area is the solution of the equations.
Examples of Solving a System of Linear Inequalities
Example 1
 and
and 
The inequality already has “ ” on the left and everything else on the right, so no need to rearrange.
Plot as a dashed line because it has  (greater than but equal) symbol and shade the area above the line.
The inequality already has “” on the left and everything else on the right, so no need to rearrange.
Plot as a solid line because it has  (less than) symbol and shade the area below the line.
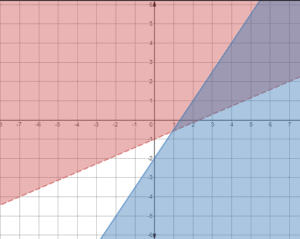
Therefore, solution of the equations will be:
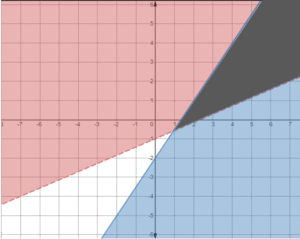
Example 2
 and
and 
The inequality already has “” on the left and everything else on the right, so no need to rearrange.
Plot as a dashed line because it has (less tham) symbol and shade the area below the line.
The inequality already has “” on the left and everything else on the right, so no need to rearrange.
Plot as a dashed line because it has  (greater than) symbol and shade the area above the line.
Therefore, solution of the equations will be:
Video-Lesson Transcript
Let’s go over solving a system of linear inequalities.
In order to do that, we have to graph our linear inequality first.
Let’s have an example.

Here we know that slope is  and -intercept is
  .
.
Let’s graph it with a solid line since it is also equal to a line.
Then let’s shade the area above this line to represent everything greater than the line.
Let’s have another inequality.

Let’s graph this.
Again, it’s a solid line since it is also equal. And shade everything below the line to represent everything which is less than the line.
Any point or coordinates in the shaded area is a solution of these two inequalities.
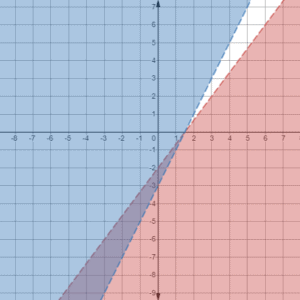
Let’s have another set of examples:


Let’s graph this system of linear inequalities
The top inequality will have a dotted line then shade everything at the bottom of the line to represent all values with less than.
The bottom inequality will have a solid line and shade the area above the lines.
Our solution is where the two shaded areas overlap.