This video describes patterns in non-linear functions and how they sometimes appear on the graph. Non-linear functions do not increase/decrease at a constant rate. This means that the rate of change can vary at different points on the grid. Instead of appearing as a straight line on a graph, it can follow different sorts of paths, yet still be a function. After you finish this lesson, view all of our Algebra 1 lessons and practice problems.
This raises the question of how to determine whether a graph is a function or not. All functions on a graph must pass what is known as a vertical line test, where a single x-value cannot have 2 y-values, otherwise, it is not a function.
Eamples of Patterns and Non-Linear Functions
Example 1
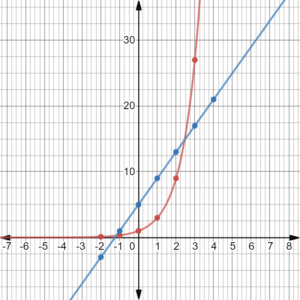
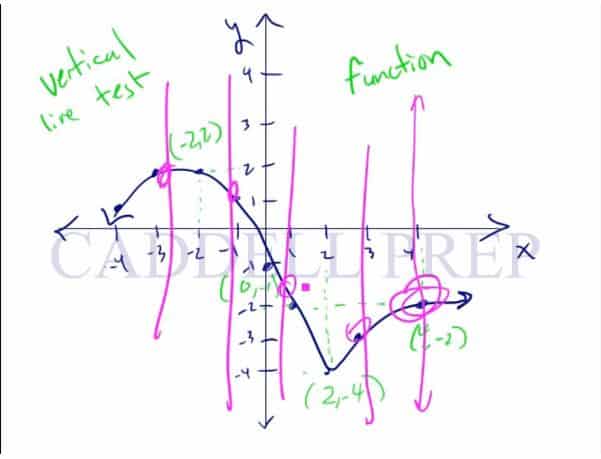
The image above has the graphs of two functions drawn (red and blue). To know if they are functions, draw a vertical line anywhere on the graph, and it should intersect the line at only one point.
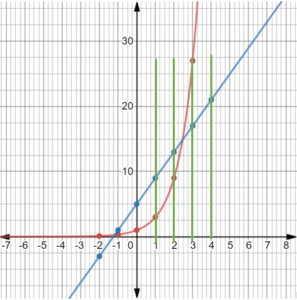
Each of the green vertical lines only intersects the blue function once, so the blue line is a function. The same is true for the red function. They both pass the vertical line test.
Example 2
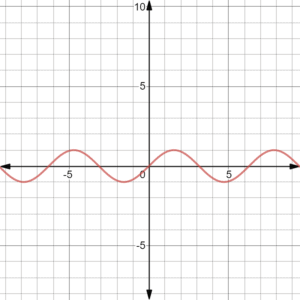
To know it is a function, draw a vertical line anywhere on the graph, and it should intersect the line at only one point.
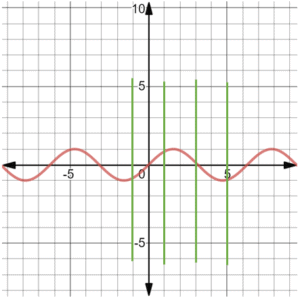
In the graph above, each green vertical line only intersects the red function once, so the red graph is a function.
Video-Lesson Transcript
Let’s go over patterns and non-linear functions.
What is a function?
We’re solving a  -value and our answer is
  -value.
The important thing here is that at most we have one -value.
Thus, we can not have two -values.
If you think of a function, think of it as a machine. When you put an -value in, it comes out -value. Or nothing at all.
Again, you will either have a -value or nothing. But it’ll never be both.
For example, if you put in  , may come out as
  . Or
. Or  then you may get
  .
.
But, we’re not going to have  . This is never going to happen. That would not be a function.
Let’s see this graphically.
Here I have a function. It’s not a specific function. This is just a representative or a model for discussion purposes.
Here, we have -values and -values.
For one -value there is one -value associated with it.
This characteristic makes it a function.
How can we tell that a graph is a function is not?
An easy way to do it is the vertical line test.
In vertical line test, you have to draw a vertical line anywhere on the graph.
If the vertical line touches only one point on the line, then that is a function.
Remember, you could draw a vertical line anywhere on the graph, even at multiple times, and it should intersect the line at only one point. Then this is a function.
Let’s see a graph that is not a function.
Let’s see if this passes vertical line test.
It passes the vertical line test in some area of the graph.
But there’s an area where the vertical line intersects the graph three times.
Which proves that this graph is not a function.
Even if the graph violates the rule once, we can already say that it’s not a function.
Let’s have another example.
Let’s graph  .
.
Does this pass the vertical line test?
Yes, it does on one side of the graph.
What about the other side?
The vertical line doesn’t touch the graph at all!
So, the answer to the first question is still yes, it’s a function.
Remember the rule that we have to have at most one -value associated with . The keyword is most.
So, we can have no -value associated with .
But we can not have two -values associated with one .
Now, let’s compare linear functions to non-linear functions.
A linear function has a perfectly straight line. Because it increases or decreases at a constant rate.
While non-linear function is the opposite. It will increase but not at a constant rate. It could be a straight line then go in a different direction. Or maybe a straight line then goes up or down. Or maybe it’s not straight at all. Maybe it’s curved. Or a lot of curves.
If it doesn’t go to a straight line consistently then it’s a non-linear function.