In this video, we are going to graph square root functions. After you finish this lesson, view all of our Algebra 1 lessons and practice problems.
The graphing calculator is a very important tool in order to graph square root functions. Without a calculator, simply find the square of each number and plot the points on a coordinate plane. Connect the points and make sure to put an arrow since the graph continues on. Keep in mind that the square root of negative numbers does not exist.
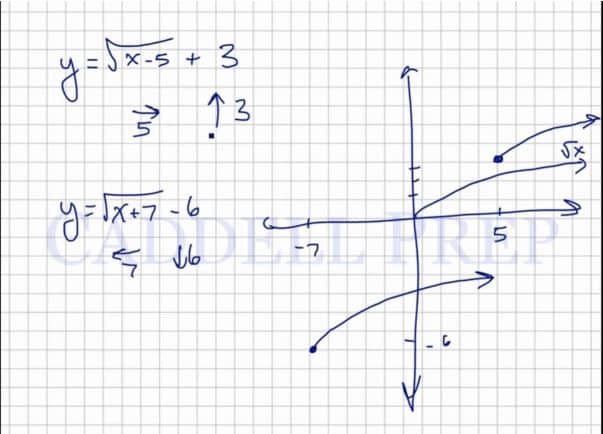
Note that when subtracting a number to the x under the radical, the graph shifts right by that many units, and when adding a number to the x under the radical, the graph shifts left by that many units. Also, when adding a number outside of the radical, the graph shifts up by that many units, and when subtracting a number outside of the radical, the graph shifts down by that many units.
Examples of Graphing Square Root Functions
Example 1

We’re going to move to the left by  spaces and down by
  .
.
Our graph will be
Example 2

We’re going to move to the right by  spaces and up by
  .
.
Our graph will be
Video-Lesson Transcript
Let’s go over how to graph square root functions.
We’ll start with the most basic one.

Let’s look at this:
If we have  , we cannot have a square root of
  . The
. The  doesn’t exist. It is imaginary.
So if then there is no value for  .
.
Same goes when  .
.
When  ,
,  ,
,
if  ,
,  ,
,
if  ,
,  ,
,
and if  ,
,  .
.
Let’s just pick numbers that we can do a square root of.
Let’s use , ,
, ,
 ,
,  ,
,
 ,
,  ,
,
and  ,
,  .
.
Now, let’s graph.
It will look like this. It will level off but not entirely.
The graph wouldn’t exist on the other side. Because the square root of negative numbers doesn’t exist.
So, this is the basic shape of a square root function.
Let’s a function that’s more complex.
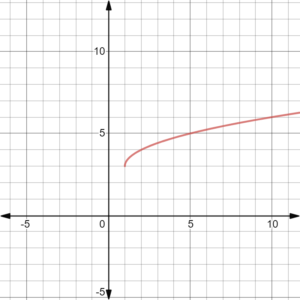
For example:

You have to remember that when you add something to a function, the line will go up by that number of spaces.
In this case, it will go up three spaces.
And if you subtract something from  , we will move to the right by that number.
So in our example, we’ll go to the right by  spaces.
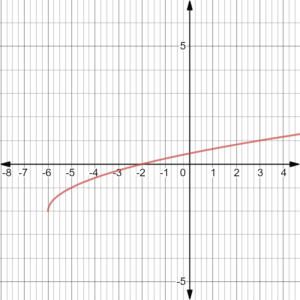
If we have this function:

this one’s going to move to the left by  spaces and down by .
Let’s graph these two.
The line will move in the direction we have but will still follow the same curve as the basic function.
So, if you add or subtract something to the , it will move to the left or right. If you add or subtract at the end, it will move up or down.
When you add to the , it moves to the left. Then if you subtract, it will move to the right.
And if you add at the end, the line will go up. If you subtract at the end, it will go down.